Using the SMILES notation for each drug, all currently available ADMET parameters were calculated utilizing the ADMETsar 3.0 platform. Subsequently, frequency distributions for several of the computed parameters were generated, and the resulting plots are presented below. The calculation of the frequency distribution of a variable and the fit to a Gaussian equation can be done using the following Python script.
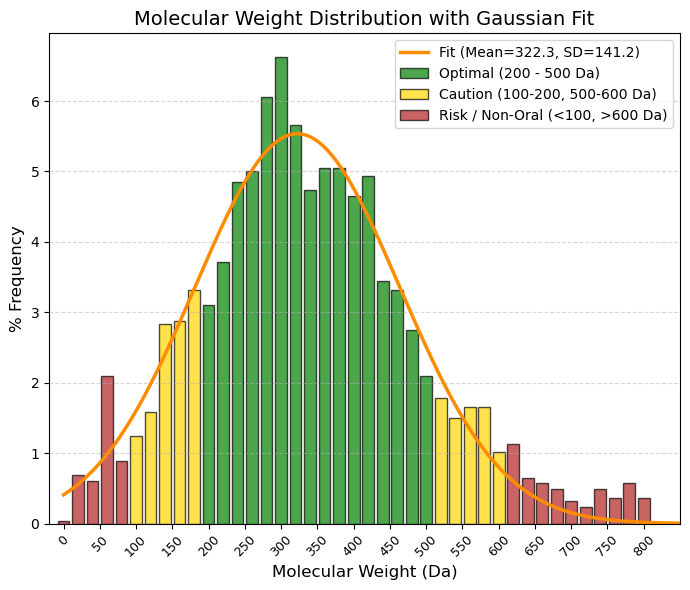
MW: Molecular weight. Unit: Da.
🟢 GREEN, 200 to 500 Da, Optimal (Lipinski Zone). This is where specificity and bioavailability intersect. Your average (322 Da) falls right in the middle of this zone.
🟡 YELLOW, 100 to 200 Da and 500 to 600 Da, “Caution/Limits. (< 200): ”Fragments." They are often too small to have high potency (they detach from the receptor). (-500 to 600): Gray zone (“Beyond Rule of 5”). Many modern drugs (such as antivirals or chemotherapy) are here. They are oral, but difficult.
🔴 RED, < 100 Da and > 600 Da, "Atypical / Risk. (< 100): Too simple (salts, solvents, gases). (- > 600): Serious oral absorption problems. They are usually injectables (biologics, large peptides) or very complex natural products.
80% values
(10.0%): 170.1 and (90.0%): 484.2 |
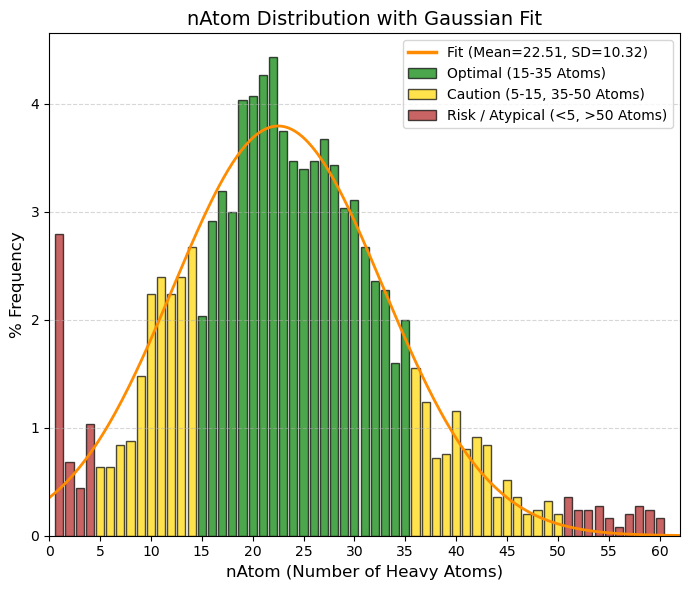
nAtom: Number of atoms (Heavy Atoms).
🟢 GREEN, 15 to 35, “Optimal (”Drug-like“ zone). Corresponds to the center of the graph (the average is 22). These are molecules with sufficient complexity to bind to the receptor, but not so large as to be insoluble.”
🟡 YELLOW, 5 to 15 and 35 to 50, “Caution. (- 5 to 15): ”Fragment-like." Very small molecules (such as Aspirin, nAtom=13). They are useful but sometimes require high doses. (- 35 to 50): Large molecules. Acceptable, but we start to have steric and solubility problems."
🔴 RED, < 5 and > 50, “Atypical / Risk. (< 5): Simple ions, salts, gases (note the peak at value 1 in your data). (- > 50): ”Beyond Rule of 5.“ Macrolides, large peptides, etc. Difficult oral administration.”
80% values
(10.0%): 11.4 and (90.0%): 32.4 |
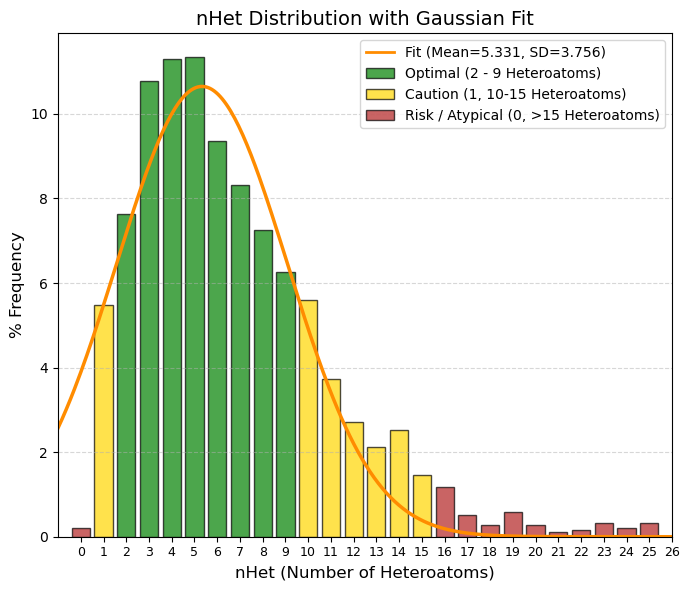
nHet: Number of heteroatoms.
🟢 GREEN, 2 to 9, Optimal Balance. This is where the vast majority of oral drugs are found. They have enough functional groups to be potent and soluble, but retain their lipophilic character. The average (5.3) is right here.
🟡 YELLOW, 1 and 10 to 15, Caution/Limits. 1: Very simple or very lipophilic molecules. Risk of rapid metabolism or low potency. 10-15: Complex molecules (antibiotics, protease inhibitors). Acceptable, but bioavailability begins to suffer.
🔴 RED, 0 and > 15, Risk / Atypical. 0: Pure hydrocarbons. Extremely rare in drugs (except inhaled general anesthetics). >15: Excessively polar or large. Difficult to absorb orally.
80% values
(10.0%): 1.7 and (90.0%): 10.7 |
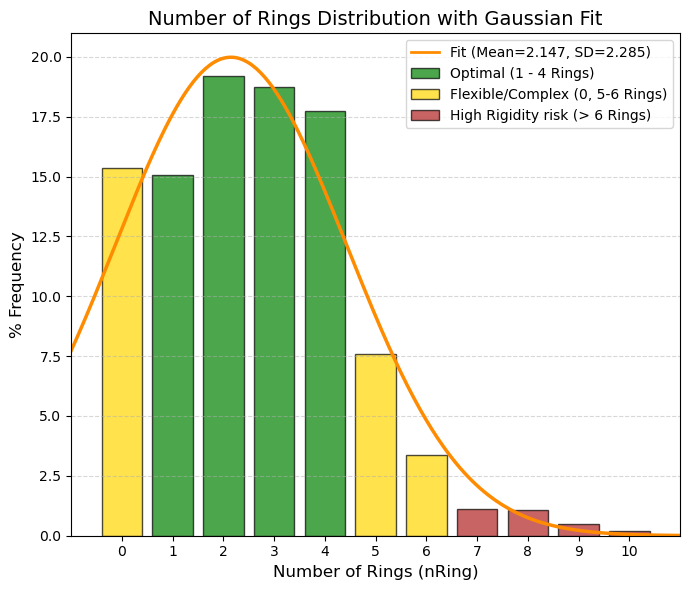
nRing: Number of rings.
🟢 GREEN, 1 to 4, Ideal Zone. They provide the necessary rigidity to fit into the active site without triggering lipophilicity or molecular weight. Almost 70% of the data is concentrated here.
🟡 YELLOW, 0 and 5 to 6, Caution. 0 (Acyclic): These account for 15%. Very flexible molecules (such as metformin). They work, but high flexibility sometimes hinders affinity (entropic penalty). 5-6: Steroids or complex structures. Risk of low solubility.
🔴 RED, > 6, High Risk. Very rigid and heavy molecules. Difficult to synthesize and often with serious solubility problems (“Brick dust”).
80% values
(10.0%): 0 and (90.0%): 5 |
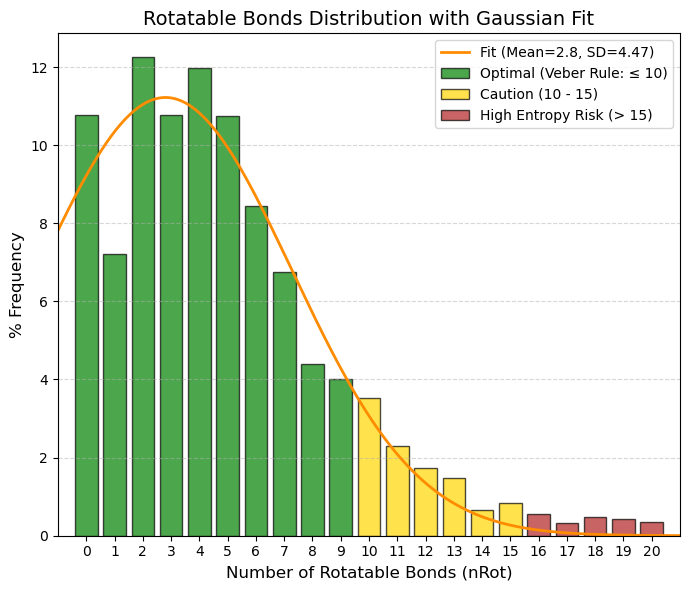
nRot: Number of rotatable bonds.
🟢 GREEN, 0 to 9, Optimal (Veber's Rule). This is where oral bioavailability is highest. The average (2.8) and the vast majority of data (almost 80%) fall within this range. The 0 to 5 range is particularly “sweet” for potent oral drugs.
🟡 YELLOW, 10 to 15, Caution/Limit. The molecule begins to be too flexible. Intestinal absorption declines significantly. It is still viable, but requires high intrinsic potency to compensate for the loss of entropy.
🔴 RED, > 15, High Risk. It is very rare to see oral drugs here. They are usually linear peptides or molecules that only work by injection, as the liver destroys them or they do not cross the membrane.
80% values
(10.0%): 0 and (90.0%): 8 |
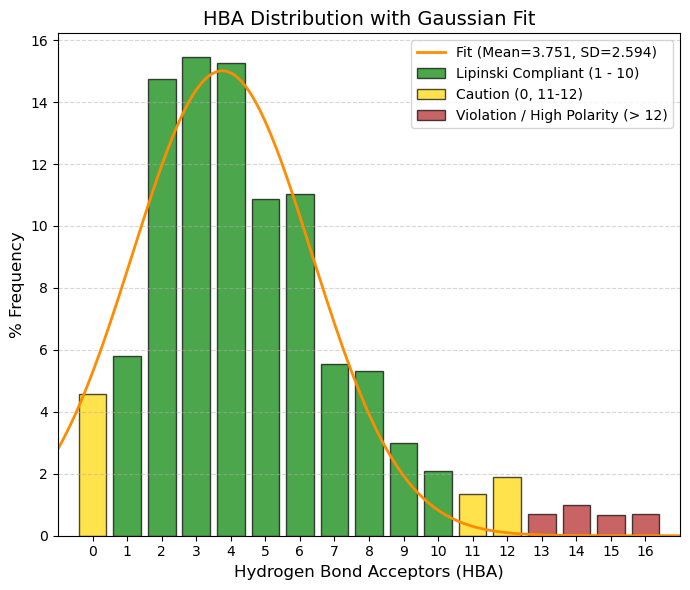
HBA: Number of hydrogen bond acceptors.
🟢 GREEN, 1 to 10, Complies with Lipinski (Safe Zone). Almost 90% of the data is here. This is the range where water solubility and fat permeability are balanced. The average (3.75) is the sweet spot.
🟡 YELLOW, 0 and 11 to 12, Caution. 0: No ability to accept hydrogen (very hydrophobic). May have solubility issues. 11-12: Slight violation of the Rule of 5. Acceptable if other parameters (such as weight) are low.
🔴 RED, > 12, High Risk (Clear Violation). Too many polar groups (too much oxygen/nitrogen). The molecule “clings” so tightly to water that it does not want to cross the lipid membrane of the intestine.
80% values
(10.0%): 1 and (90.0%): 8 |
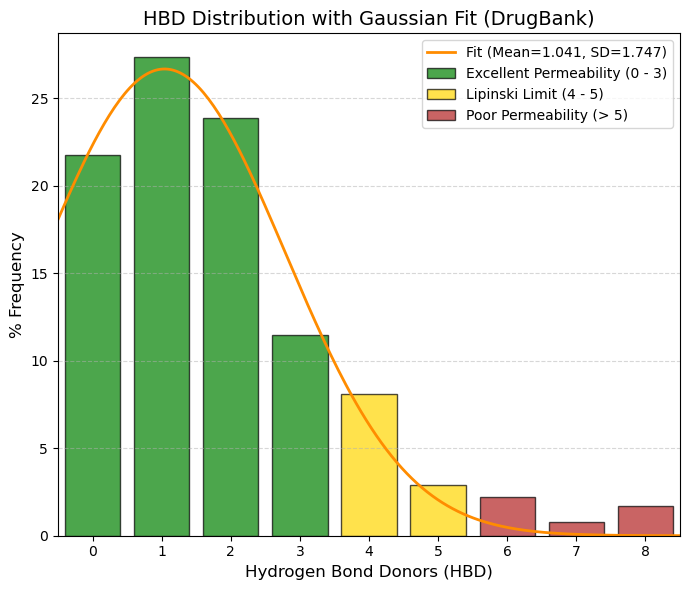
HBD: Number of hydrogen bond donors.
🟢 GREEN, 0 to 3, Zone of Excellence. Adding up the percentages, 84.3% of drugs are here. 0 (21.7%): Drugs without OH or NH. They cross membranes very quickly (if they are not too large). 1 (27.3%): The most common value.
🟡 YELLOW, 4 to 5, Lipinski's Limit. Still acceptable, but permeability begins to suffer. Only ~11% of your data falls here.
🔴 RED, > 5, Violation. Too many “sticky” polar groups (OH/NH). The molecule prefers to stay in water rather than cross the cell's fat. In your data, this is almost non-existent (< 2.5%).
80% values
(10.0%): 0 and (90.0%): 4 |
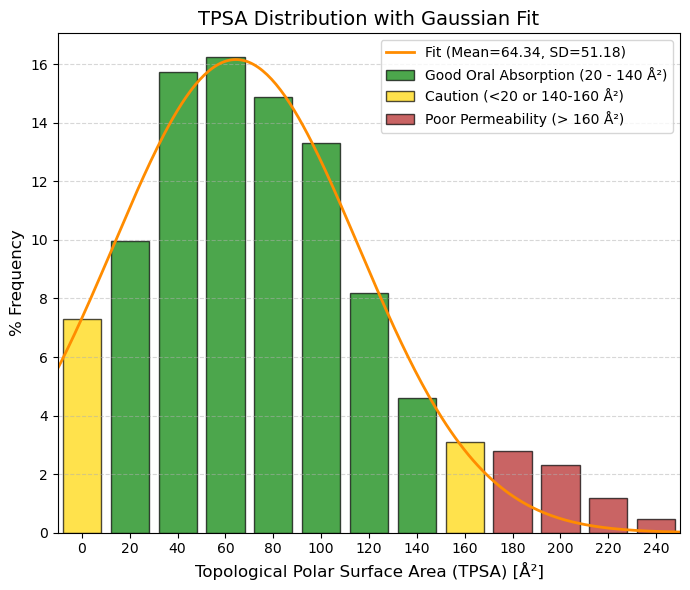
TPSA: Topological polar surface area.
🟢 GREEN, 20 to 140 Ų, Optimal Zone (Oral Absorption). This is where “the magic happens.” 20-90 Ų: High permeability (even brain). 90-140 Ų: Good intestinal absorption. Almost 85% of the data is here.
🟡 YELLOW, 0 to 20 and 140 Ų to 160 Ų, Caution. 0-20 Ų: Very “greasy” (non-polar) molecules. They are well absorbed but bind too much to proteins or are toxic. 140-160 Ų: Absorption begins to drop dramatically.
🔴 RED, > 160 Ų, Poor Absorption. The molecule is too polar to cross the lipid membrane of cells. Only viable for injectables or extracellular targets.
80% values
(10.0%): 13 and (90.0%): 138 |
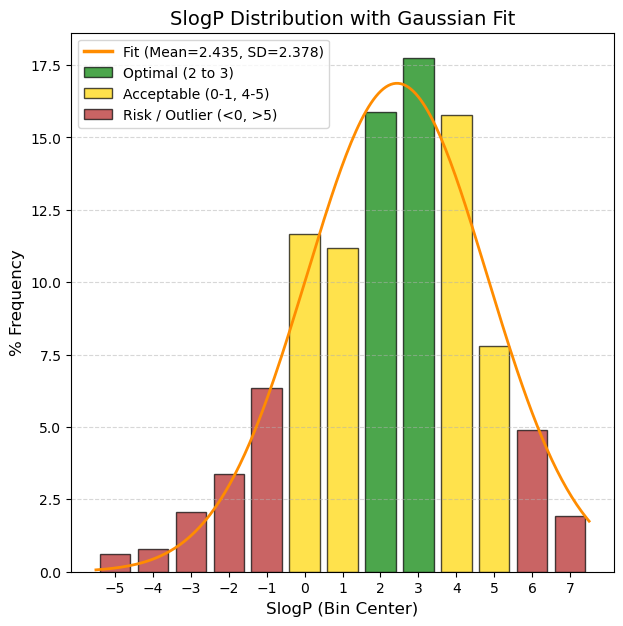
SlogP: The logarithm of the n-octanol/water distribution coefficient. Based on the RDKit calculation.
🟢 GREEN, 1.0 to 3.5, Optimal, “This is the ‘sweet spot’. The molecule is fatty enough to cross membranes, but soluble enough to dissolve in blood. These are the best candidates.”
🟡 YELLOW, 0 to 1.0 and 3.5 to 5.0, Acceptable/Caution, "Low (0-1): Risk of being too polar; may have difficulty entering the cell unless using an active transporter. High (3.5-5): Meets Lipinski's rule (limit 5), but starts to have solubility and metabolic risk issues."
🔴 RED, < 0 and > 5.0, Critical / Discard*, “< 0: Too hydrophilic (like sugar). Difficult passive intestinal absorption. Excreted very quickly by the kidney. > 5: Too lipophilic (like wax). Accumulates in fat, potential toxicity, poor solubility.”
80% values
(10.0%): -0.6 and (90.0%): 4.95 |
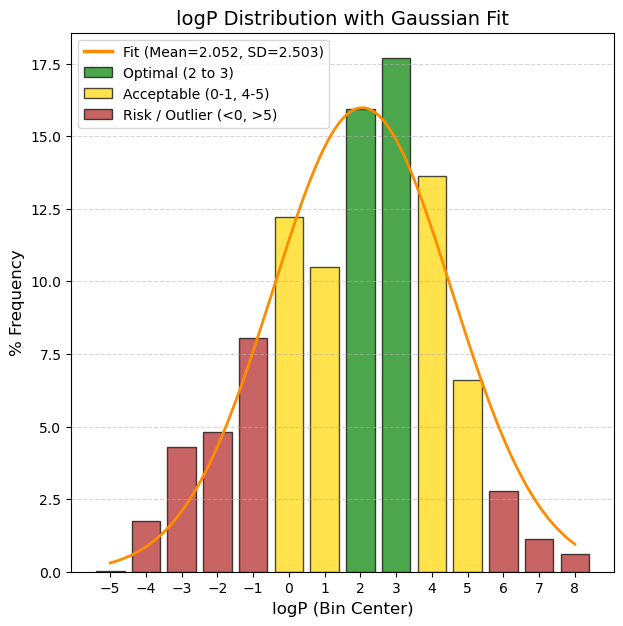
logP: The logarithm of the n-octanol/water distribution coefficient. Based on the CLMGraph model prediction.
🟢 GREEN, 2 to 3, Optimal/Good Solubility. The drug dissolves well in gastrointestinal fluids. This is the ideal range for simple oral formulations.
🟡 YELLOW, 0 <= x < 2 or 4 <= x <= 5: Low solubility. Very common in modern drugs, but requires formulation tricks (salts, special excipients).
🔴 RED, < 0 and > 5, Critical / Difficult development. (< -6): Practically insoluble. High risk of not being absorbed (”brick dust effect“). (> 1): Extremely hydrophilic. It is excreted very quickly or does not enter the cell.
80% values
(10.0%): -1.26 and (90.0%): 4.7 |
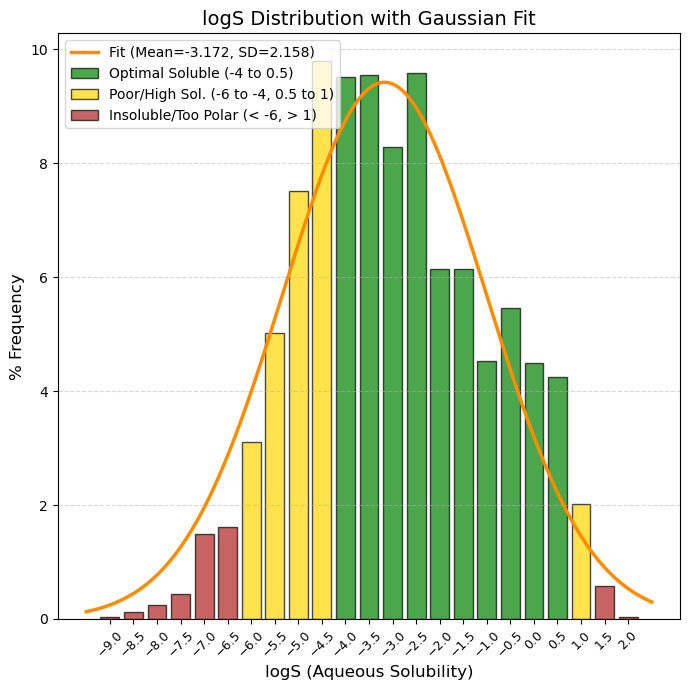
logS: Logarithm of water solubility value. Unit: -log mol/L.
🟢 GREEN, -4 to 0.5, Optimal/Good Solubility. The drug dissolves well in gastrointestinal fluids. This is the ideal range for simple oral formulations.
🟡 YELLOW, -6 to -4 and 0.5 to 1, "Caution. (-6 to -4): Low solubility. Very common in modern drugs, but requires formulation tricks (salts, special excipients). (> 0.5): Very soluble. Sometimes indicates that the molecule is too polar to cross membranes."
🔴 RED, < -6 and > 1, “Critical / Difficult development. (< -6): Practically insoluble. High risk of not being absorbed (”brick dust effect“). (> 1): Extremely hydrophilic. It is excreted very quickly or does not enter the cell.”
80% values
(10.0%): -5.4 and (90.0%): -0.5 |
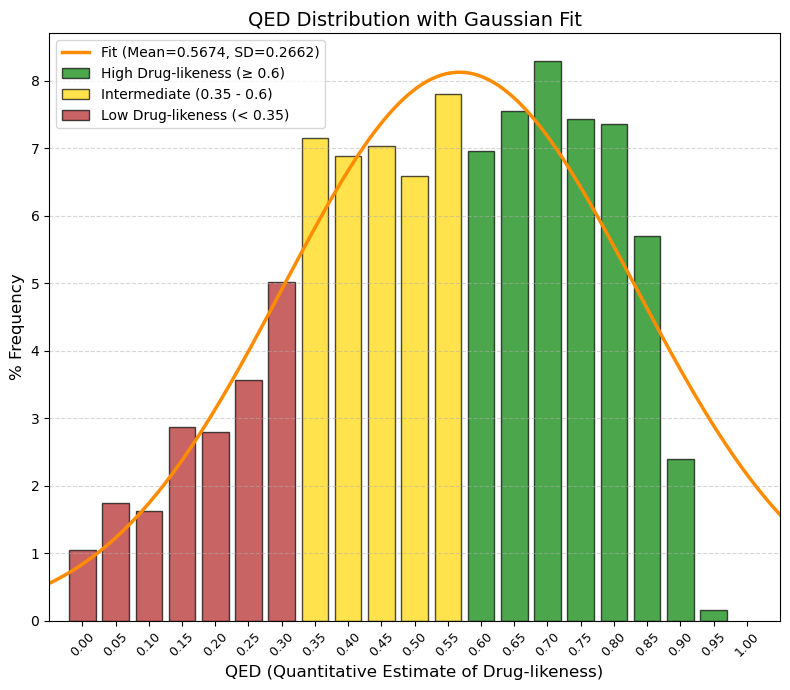
QED: The quantitative estimate of drug-likeness (QED) indicator.
🟢 GREEN, ≥ 0.60, “High Drug-likeness (Ideal). Here are the ‘nice’ molecules: easy to synthesize, good absorption, good distribution. In this data, the frequency rises sharply here (peak at 0.7).”
🟡 YELLOW, 0.35 to < 0.60, “Intermediate / Acceptable. This is where your average falls (0.56). These molecules are a little more complex, perhaps heavier or with more polar groups, but perfectly viable as drugs.”
🔴 RED, < 0.35, “Low Drug-likeness (Complex/Difficult). Very large, very flexible molecules or molecules with poor physicochemical properties. They usually require injection or very complex formulations.”
80% values
(10.0%): 0.26 and (90.0%): 0.81.
Bickerton, G., Paolini, G., Besnard, J. et al. Quantifying the chemical beauty of drugs. Nature Chem 4, 90-98 (2012). 10.1038/nchem.1243 |
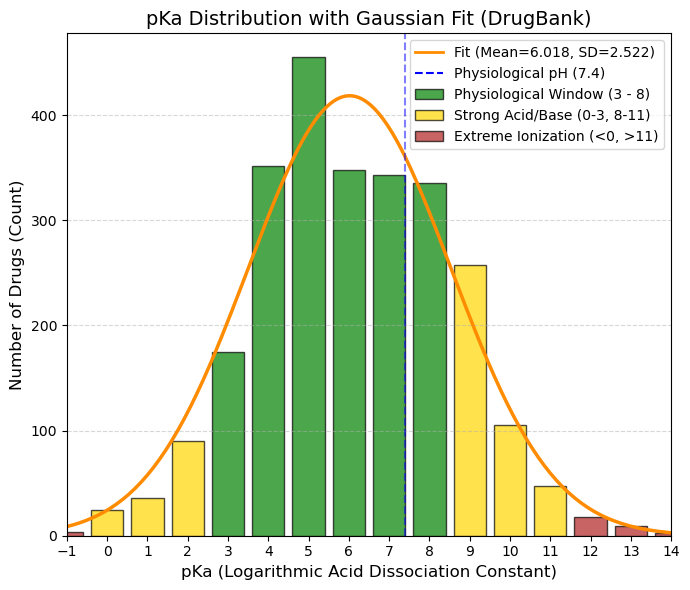
pKa: The logarithmic acid dissociation constant.
🟢 GREEN, 3 to 8, Gold Zone (Physiological Window). This is where the bulk of the data is concentrated (the values of 300-400 drugs). These drugs change their ionization state within the pH range of the human body (stomach pH 2 -> blood pH 7.4).
🟡 YELLOW, 0 to 3 and 8 to 11, Caution/Specific. 0-3: Strong acids. They almost always ionize (such as aspirin, pKa ~3.5). Good for the stomach, but can cause irritation. 8-11: Strong bases (such as antidepressants/beta-blockers). They are well absorbed in the intestine, but can become trapped in lysosomes.
🔴 RED, < 0 and > 11, Extremes (Permanent Ionization). Here the drug is almost always 100% ionized. Very difficult to cross membranes by passive diffusion. They usually require active transport or injection.
(5.0%): 2.12 and (95.0%): 10.06 |
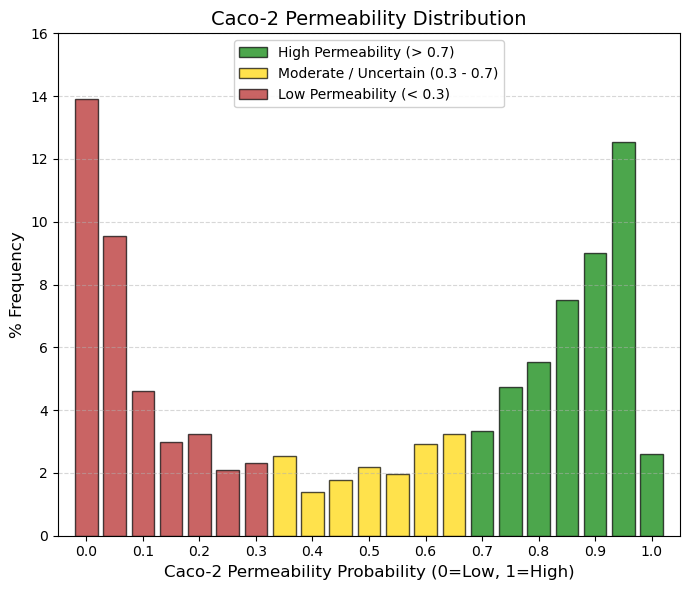
Caco-2: Caco2 cell permeability.
🟢 GREEN, > 0.7, High Permeability (Absorption Zone). These are drugs that easily cross the intestine by passive diffusion. This is ideal for an oral drug (the right peak is here).
🟡 YELLOW, 0.3 to 0.7, Gray Zone/Moderate. The drug has medium permeability or the model is uncertain. It may require higher doses or special formulations.
🔴 RED, < 0.3, Low Permeability. Here we have a huge peak (401 drugs at 0). What is the reason? They are injectable drugs (they do not need Caco-2) and are very large/polar. In addition, they use active transport (Caco-2 sometimes fails to predict specific transporters). |
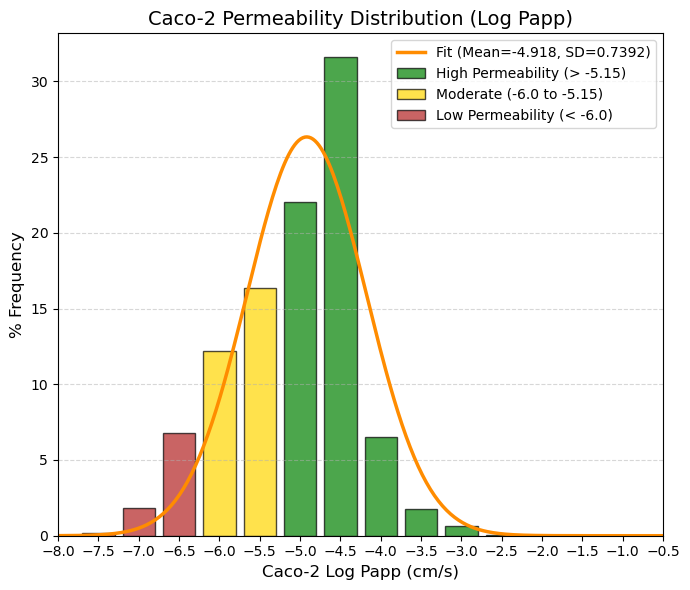
Caco_2_c: Caco2 cell permeability.
🟢 GREEN > -5.15 High permeability. Corresponds to human absorption > 80%. Here you have a big spike: the -4.5 bin has a massive 31.6% and the -5 bin has 22%. Most drugs are found here.
🟡 YELLOW -6.0 to -5.15 Moderate. Variable absorption (20-80%). Requires formulation or high doses. The ADMETsar model shows a transition here.
🔴 RED < -6.0 Low permeability. Absorption < 20%. The data show a tail to the left (-6.5, -7) that probably corresponds to drugs that are administered parenterally or that act locally in the intestine.
80% values
(10.0%): -6 and (90.0%): -4.16. |
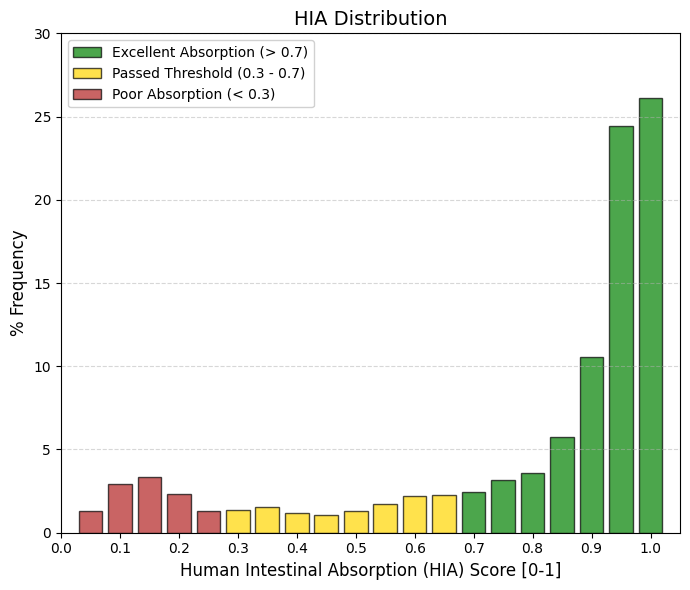
HIA: Human Intestinal Absorption.
🟢 GREEN > 0.7 Optimal Absorption. This is where successful oral drugs “live.” Adding up the frequencies from 0.7 to 1, you have more than 70% of all drugs. The peak is at 1.0 (26%) and 0.95 (24.4%). This indicates that the real standard is not 30%, but closer to 100%.
🟡 YELLOW 0.3 to 0.7 . Acceptable Absorption (Pass Zone). They meet the study criteria (>30%), but are not ideal. Only a small percentage of drugs fall here (~12%). They usually require higher doses to compensate for what is not absorbed.
🔴 RED < 0.3 Poor Absorption. By definition, these are HIA- (negative). Adding up the low frequencies, you have a significant group (approx. 11-12%) in the 0.05-0.2 range. These are almost certainly intravenous, topical, or inhaled drugs. |
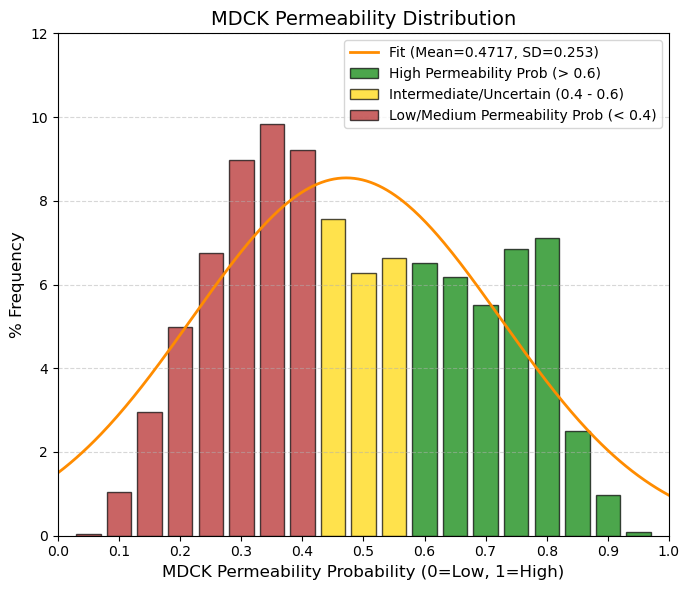
MDCK: Madin-Darby Canine Kidney cells (MDCK) Permeability.
🟢 GREEN, > 0.6, High Permeability (Clear Prediction). The model is confident that the compound exceeds the threshold of 8⋅10-6 cm/s. Adding up the frequencies, approximately 30-35% of drugs are here.
🟡 YELLOW, 0.4 to 0.6, Gray Zone/Uncertainty. This is where the average (0.47) falls. It is the most populated zone. The model cannot be sure whether it is high or low, or whether the compound has intermediate permeability. This is the “standard” behavior of an average drug.
🔴 RED, < 0.4, Medium-Low Permeability. The model confidently predicts that the drug is NOT highly permeable. This is common in drugs that act on peripheral receptors and we do not want them to cross all barriers (e.g., second-generation antihistamines).
80% values
(10.0%): 0.24 and (90.0%): 0.73.
Probabilidad de alta permeabilidad (High MDCK permeability). 0.6 - 1.0 → Alta permeabilidad muy probable. |
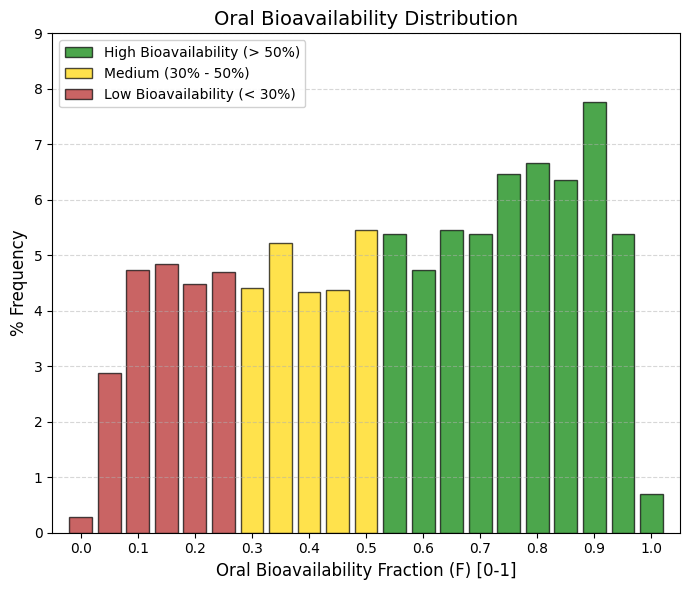
F50: Oral bioavailability (F50).
Bioavailability (F50) measures how much of the drug reaches the bloodstream intact after passing through the liver. The difference between the previous graph (HIA) and this one (F) is the first-pass effect (hepatic metabolism). Many drugs are well absorbed, but the liver destroys them before they can work.
🟢 GREEN, > 0.5, High Bioavailability (>50%). This group includes the majority (~54% of the data). These are robust drugs that survive the liver. The peak is at 0.9 (7.8%), indicating that the most successful drugs are those that manage to evade hepatic metabolism.
🟡 YELLOW, 0.3 to 0.5, Medium/Low. This corresponds to ~19% of the data. These are drugs that require higher doses because a significant portion is lost along the way.
🔴 RED, < 0.3, Very Low (<30%). Approximately 27% of drugs fall into this category. Note: Unlike other parameters, having a low F is not always a “failure.” Many drugs (such as statins or some antihypertensives) have low bioavailability but are very potent, so the small fraction that reaches the blood is sufficient. |
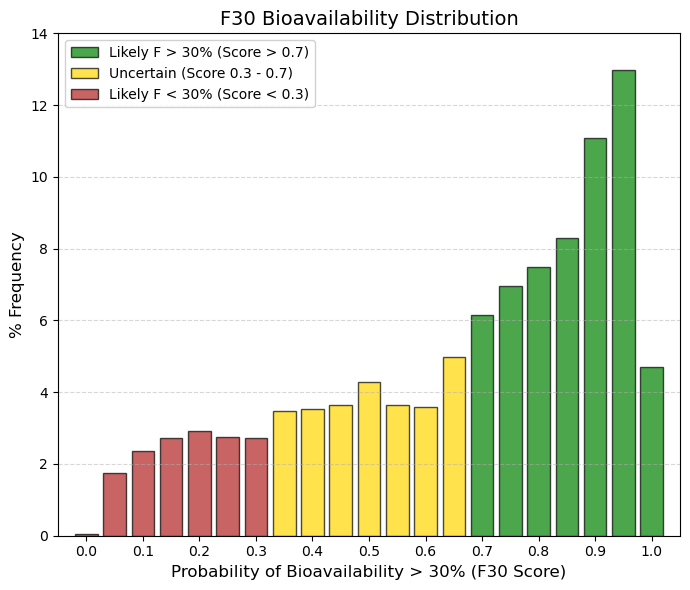
F30: Oral bioavailability (F30).
It is difficult to guarantee more than 50% bioavailability. Drugs are distributed equally; it is not a strict requirement for approval. It is “easy” (and almost mandatory) to exceed 30%. Most approved drugs pass this test with flying colors. |
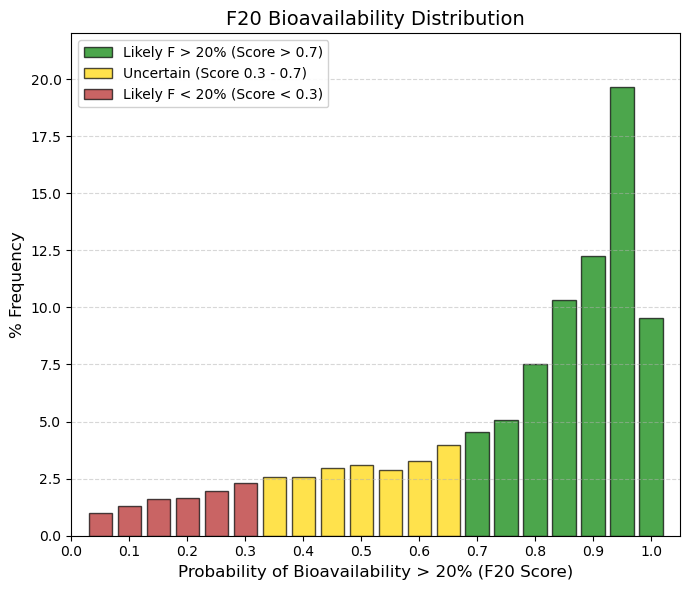
F20: Oral bioavailability (F20).
By lowering the requirement to F20 (Bioavailability > 20%), virtually all drugs “pass” the test. This means that for an FDA/EMA-approved drug, having less than 20% bioavailability is almost unacceptable (except in very powerful cases). The ADMETsar model knows this and therefore assigns very high probabilities to most drugs. |
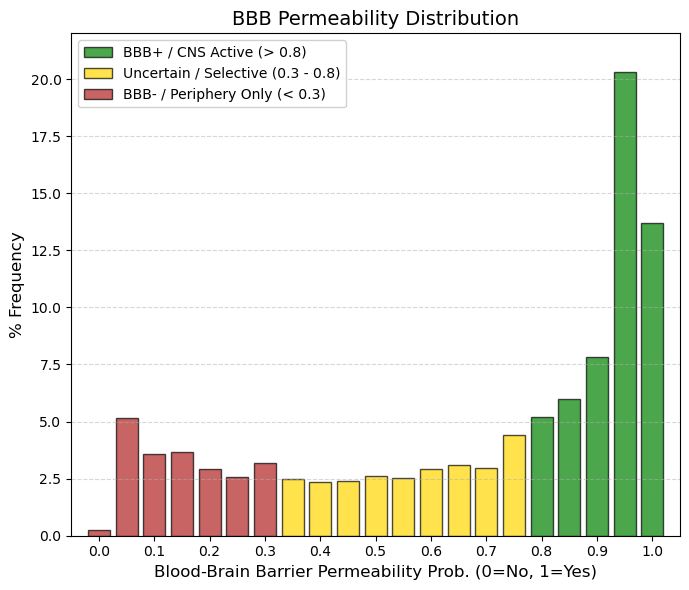
BBB: Blood-Brain Barrier Permeability.
The blood-brain barrier (BBB) protects the central nervous system (CNS) by separating brain tissue from blood as part of absorption. It is formed mainly by the brain endothelium and prevents the entry of larger (≈100%) and smaller (≈98%) molecules into the CNS, allowing only water- and lipid-soluble molecules and selective transporters to cross itself, while the channel expresses a number of active transporters, such as P-glycoprotein and glucose transporters, preventing the entry of lipophilic potential neurotoxins.
🟢 GREEN, > 0.8, BBB+ (High Permeability). This accounts for ~47% of the data. These are molecules that easily enter the Central Nervous System (CNS). The peak at 0.95 suggests that many approved drugs are highly penetrant.
🟡 YELLOW, 0.3 to 0.8, Intermediate/Selective Zone. This is a very flat “no man's land” (low frequencies of 2-3%). These are probably drugs that partially enter or are substrates of efflux pumps (P-gp) that remove them.
🔴 RED, < 0.3, BBB- (Low Permeability). Here there is a small group (~15%) concentrated at 0 and 0.05. These are drugs that do not affect the brain. Ideal for systemic antibiotics or cardiovascular drugs that want to avoid neurotoxicity. |
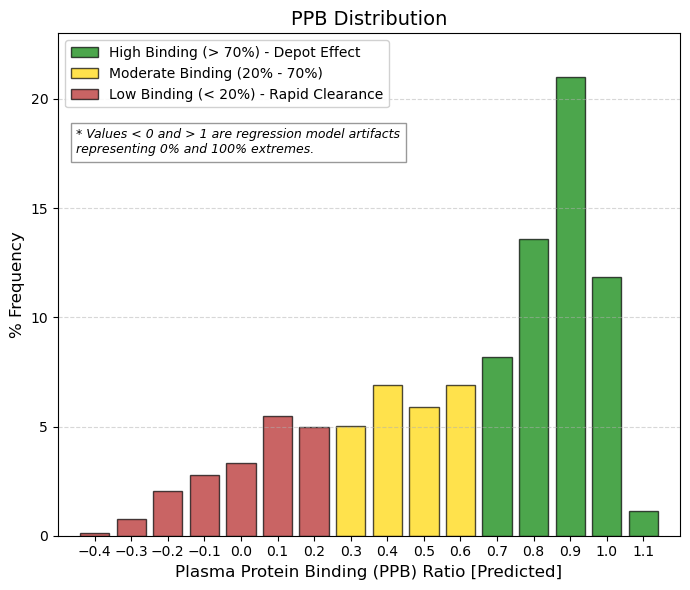
PPB: Plasma protein binding ratio.
Plasma protein binding is a very important pharmacokinetic property, which is expressed as the binding affinity of a drug to plasma proteins, and can effectively regulate the effective concentration of a drug at a pharmacological target. When a drug is absorbed by the body into the blood circulation, it selectively binds to plasma proteins. However, only the unbound portion of the drug can reach the specific target and produce therapeutic effects. Therefore, when a drug has a high affinity for plasma proteins, it means that it often requires a higher dose to reach a therapeutic concentration at the target and to exert its effect.
🟢 GREEN, > 0.7, High Union (Standard). This is where the vast majority of drugs are found (~55% of the data). The peak at 0.9 (21%) is the highest. Why? Because for a drug to be well absorbed (HIA+), it tends to be lipophilic. And albumin loves lipophilic compounds. It is a “toll” that must be paid for good oral absorption.
🟡 YELLOW, 0.2 to 0.7, Moderate Binding. Represents ~35% of drugs. These are more balanced compounds, with a higher free fraction, which allows for lower doses, but they tend to be eliminated more quickly.
🔴 RED, < 0.2, Low Binding / Artifacts. Values close to 0 or negative are rare (~10%). These are usually very polar (hydrophilic) drugs that are eliminated very quickly by the kidney unless they have special mechanisms. |
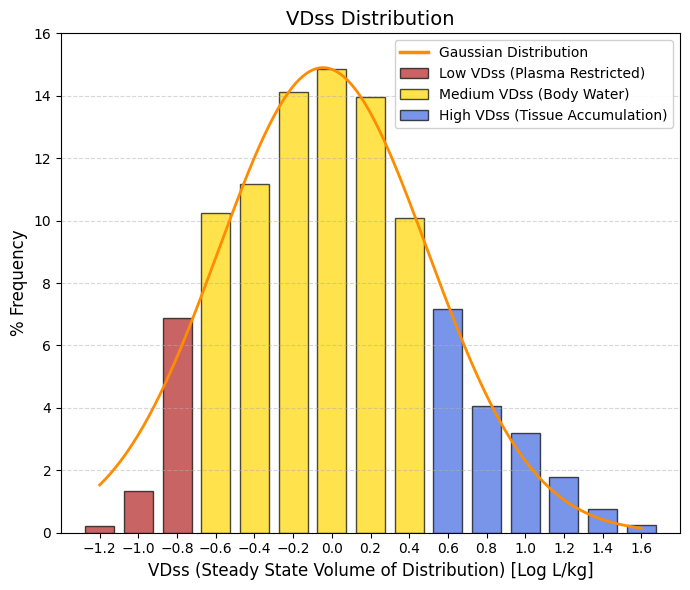
VDss: Steady state volume of distribution. Unit: -log L/kg.
🔴 Low VDss, < -0.6, “Confined to Plasma (< 0.25 L/kg). Drugs that do not leave the blood (too large or too tightly bound to albumin). They represent the left tail of the bell curve. Useful for blood infections, but poor for reaching deep tissues.”
🟡 Medium VDss, -0.6 to 0.5, Total Body Water (0.25 - 3 L/kg). This is where the bulk of the bell curve is (including the mean). The drug is well distributed throughout the body's water and enters the tissues moderately. This is standard behavior.
🔵 High VDss, > 0.5, Tissue Accumulation (> 3 L/kg). Lipophilic drugs that “disappear” from the blood and hide in fat or muscle (e.g., antidepressants, antipsychotics). They represent the right tail. They have very long half-lives. |
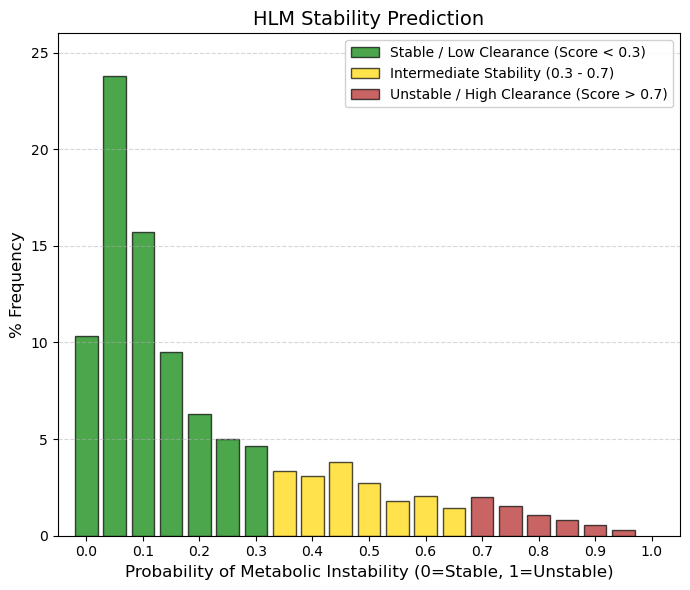
HLM: Human liver microsomal stability predictor.
🟢 GREEN, < 0.3, Stable (Slow/Moderate Metabolism). Approximately 65% of drugs fall into this category. They have a low probability of being rapidly degraded by hepatic microsomes. This allows for a reasonable half-life for dosing.
🟡 YELLOW, 0.3 to 0.7, “Intermediate Zone.” Represents ~29% of drugs. These are compounds that undergo significant but manageable metabolism.
🔴 RED, >0.7, Unstable (Rapid Metabolism). This is the least populated zone (~6%). Drugs that fall here disappear very quickly from the blood. They are usually prodrugs (designed to break down) or ultra-short-acting drugs (such as some anesthetics or hypnotics). |
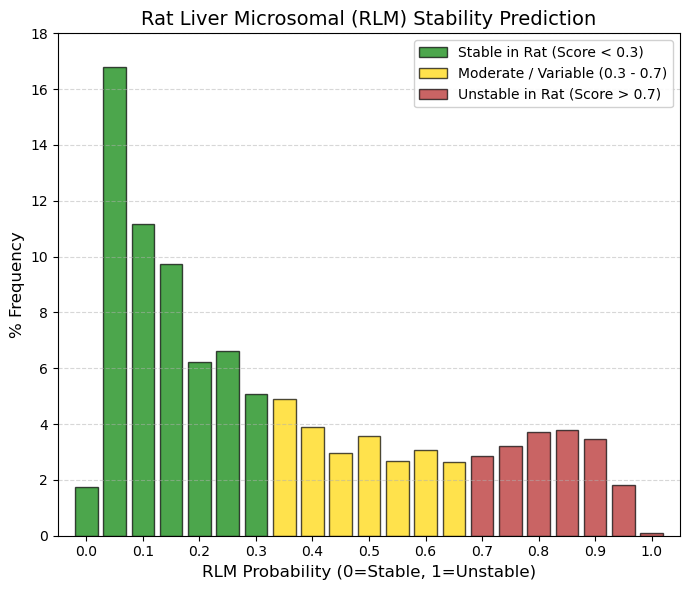
RLM: Rat liver microsomal stability predictor.
While in HLM (Humans) the vast majority was concentrated in 0 - 0.15, RLM (Rats), although the peak remains at 0.05 (16.8%), the tail to the right is much thicker. Look at the 0.8-0.9 range: in humans there was almost nothing (~1%), but in rats there is almost 11% accumulated in that area of instability. Rats have a much faster metabolism and a more aggressive enzyme profile (cytochromes P450) than humans. This means that many drugs that are stable in humans (low HLM) appear unstable in rats (high RLM). This is a classic “false negative” problem in drug development: compounds are discarded because rats destroy them, even though they would have worked well in humans.
🟢 GREEN, < 0.3, Stable in Rats. Groups ~50% of the data (in HLM it was 65%). If a drug is stable here, it will almost certainly be stable in humans. This is the ideal scenario for preclinical trials.
🟡 YELLOW, 0.3 to 0.7, Moderate Metabolism. A very populated area (~30%). Many drugs that require dose adjustments between species (allometric scaling) are found here.
🔴 RED, > 0.7, Unstable in Rats. There is a significant group here (~19-20%). Many of these drugs are approved. This shows that a drug can be approved even if rats metabolize it quickly, as long as it is stable in humans (HLM). |
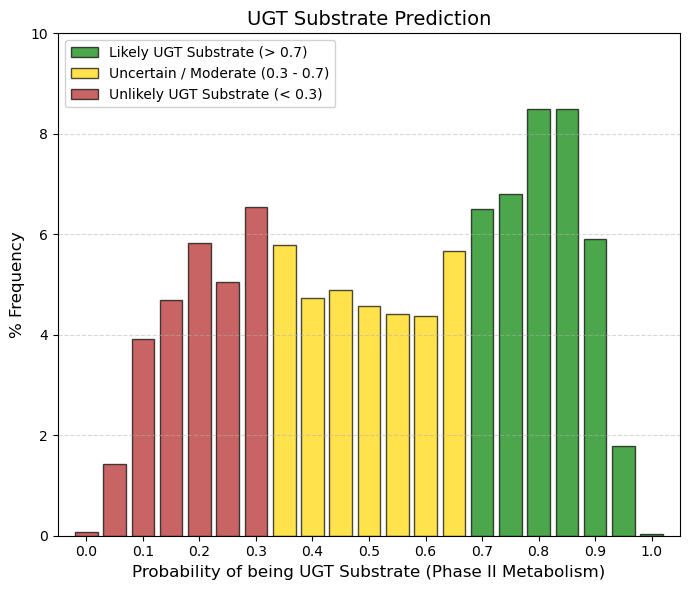
UGT substrate: UGT enzyme substrate predictor.
UDP-glucuronosyltransferases (UGTs) have gained increasing attention as they play important roles in the phase II metabolism of drugs.
🟢 GREEN, > 0.7, Probable UGT Substrate. This is where ~31% of the data is concentrated at the peak on the right. These are drugs that the body eliminates by attaching sugar (glucuronic acid) to them. It is a safe and common route of elimination.
🟡 YELLOW, 0.3 to 0.7, Mixed Zone. The bulk of the population (~51%) is in this central plateau. The model is inconclusive or the drug has moderate conjugation.
🔴 RED, < 0.3, Not UGT Substrate. Represents ~18% of the data (left side). These drugs are eliminated by other routes (direct unchanged urine or exclusive CYP metabolism). |
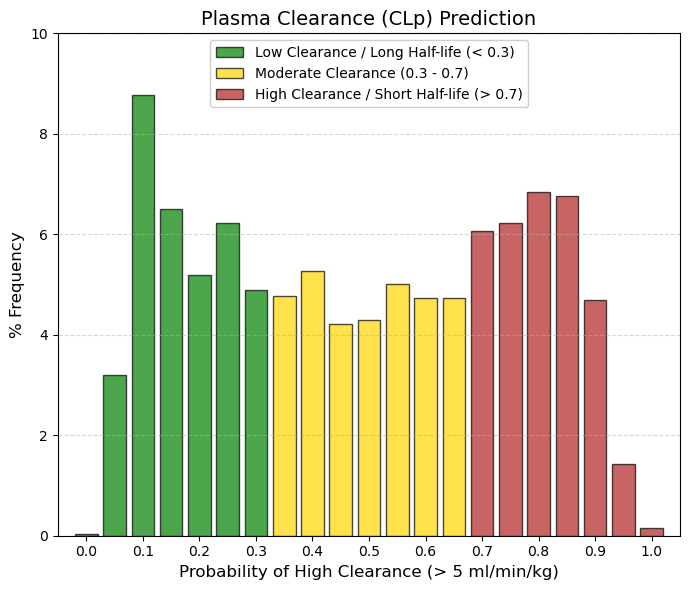
CLp: Plasma clearance is the sum of hepatic and renal and other drug clearance.
🟢 GREEN, < 0.3, Low Clearance (< 5 mL/min/kg). This is where ~24% of drugs fall (left peak). They are ideal for once-daily dosing or long half-life. The body takes a long time to get rid of them.
🟡 YELLOW, 0.3 to 0.7, Moderate Clearance. The vast majority (~40%) fall here. The drug is eliminated at a steady rate. It will likely require dosing every 8-12 hours.
🔴 RED, > 0.7, High Clearance (> 5 mL/min/kg). This represents a large block (~36%). These are drugs that the body eliminates efficiently. It is not “bad” (it prevents toxic accumulation), but it requires frequent doses or extended-release formulations. |
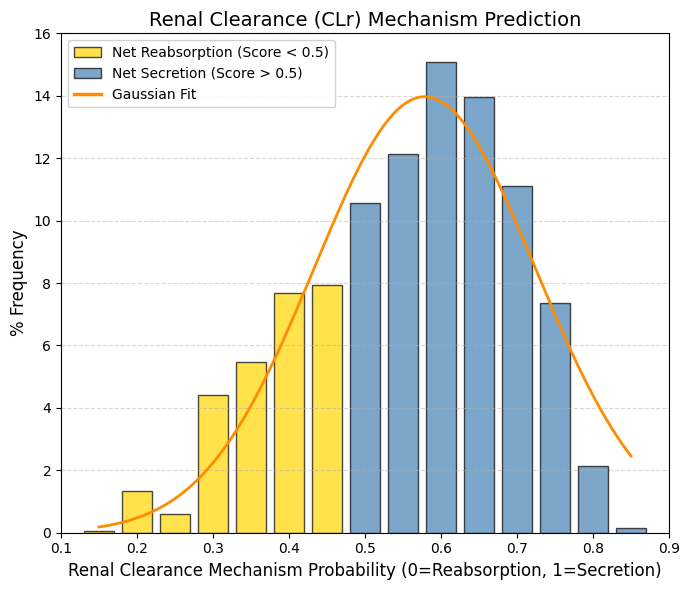
CLr: Renal Clearance.
🟡 Net Reabsorption, < 0.5, The drug returns to the bloodstream. This represents the left tail. These are drugs that the body tries to retain. They tend to have longer half-lives unless they are metabolized by the liver.
🔵 Net secretion, > 0.5, The drug is actively expelled. Represents the majority of the bell curve (including the mean). The renal transport system (OAT/OCT) recognizes the drug and eliminates it.
The observed bias toward active secretion (Score > 0.5) suggests that successful drugs are often substrates of specialized renal transport systems. As described by Giacomini et al. (2010), the proximal tubule functions as an organ of active elimination. Specifically, organic anions are cleared by the OAT family (Nigam et al., 2015), whereas cations exploit the electrochemical gradient via OCT transporters (Koepsell, 2020). This evolutionary machinery enables efficient clearance of xenobiotics, thereby reducing systemic toxicity, but it also introduces the risk of drug-drug interactions due to competition for shared transporters. |
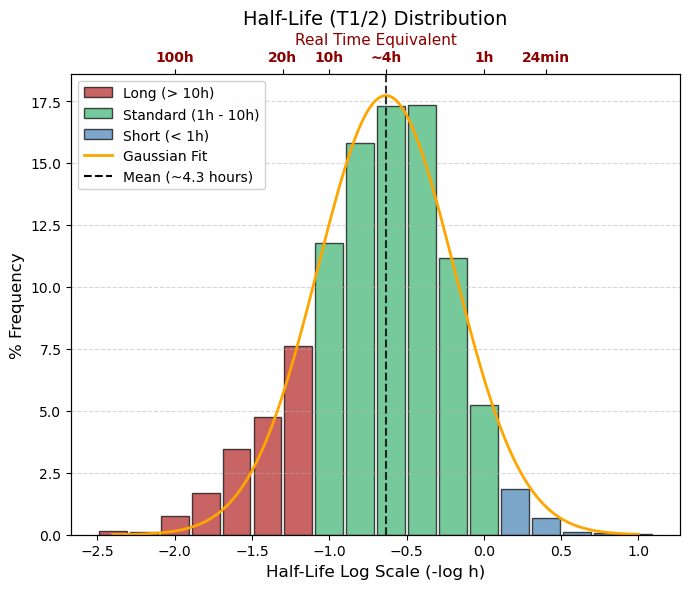
T1/2 (=T50): -log10 (hour)
🔵 Logarithmic range > 0, real time < 1 hour, Ultra-Short, (~7% of data). Eliminated very quickly. Typical of anesthetics or emergency drugs that must disappear quickly.
🟢 Logarithmic range -1.0 to 0, real time 1 to 10 hours, Standard (Average), The Vast Majority. Ideal for doses 3 or 4 times a day (TID/QID). This is where the peak of the graph falls (4 hours).
🔴 Logarithmic range < -1.0, real time > 10 hours, Long Duration, (~30% of data). Ideal for once a day (QD). If it is very negative (e.g., -2.0 = 100 hours), there is a risk of accumulation. |
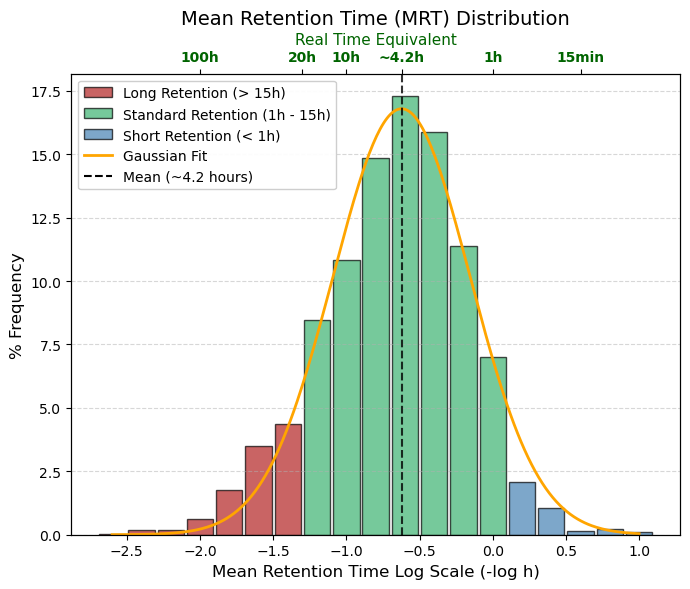
MRT: -log10 (hour), Mean Retention Time
🔵 Rapid elimination, Logarithmic range > 0, Estimated time in hours < 1 hour, Very short-acting drugs. Useful for acute effects, but inconvenient for chronic treatments.
🟢 Standard (Optimal Zone), Logarithmic range -1.2 to 0, Estimated time in hours 1 to 15 hours, The bulk of the bell curve. Allows for convenient dosing (every 8, 12, or 24 hours). The body has time to act on the drug and eliminate it before the next dose.
🔴 Long-acting, Logarithmic range < -1.2, Estimated time in hours > 15 hours, Drugs that “stick” to tissues or recirculate. They have a risk of accumulation if taken too often, but are excellent for single daily doses. |
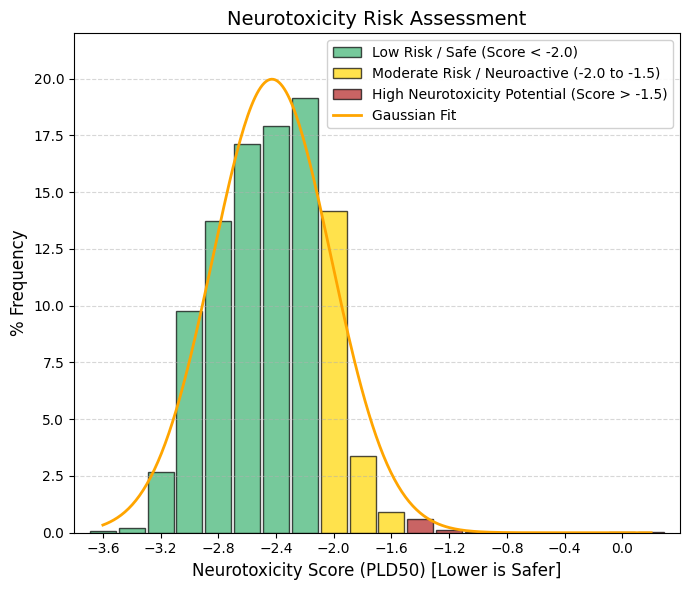
Neurotoxicity.
Neurotoxicity is one of the main reasons for drug discontinuation and there is a need for risk assessment of neurotoxicity of drugs or compounds. Drugs cause neurotoxicity mainly by affecting mitochondrial respiration, immune-mediated responses and inhibiting neuronal activity. Drugs with neurotoxicity can be broadly categorized into three groups, including antibacterials, antifungals, and antidepressants.
🟢 GREEN, < -2.0, Safe Zone (Low Risk). The vast majority (~85%) are concentrated here. The drug is very safe for nerve tissue at therapeutic doses.
🟡 YELLOW, -2.0 to -1.5, Moderate Risk / Neuroactive. A transition zone. Drugs that may have mild side effects on the nervous system (dizziness, drowsiness).
🔴 RED, > -1.5, High Neurotoxic Potential. There are very few cases (the flat right tail). These are generally chemotherapy drugs or powerful psychiatric drugs where the effect on neurons is part of the mechanism or an accepted risk. |
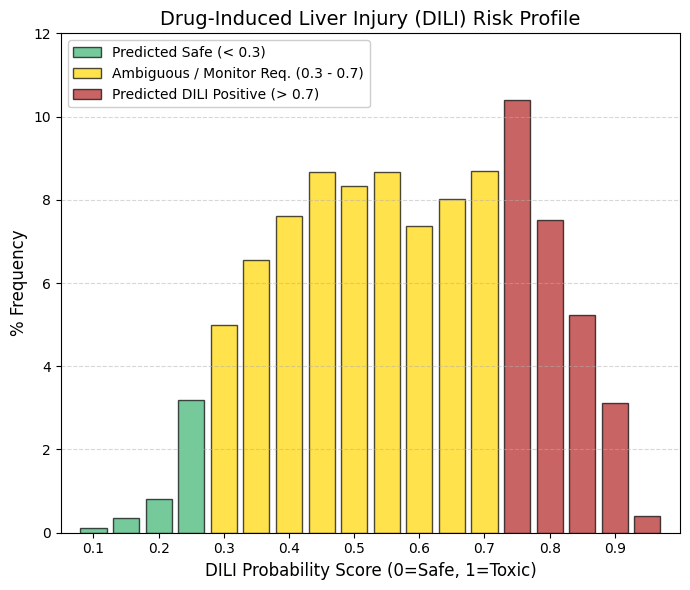
DILI: Drug-induced hepatotoxicity, also known as drug-induced liver injury.
🟡 The “Gray Zone” (Yellow Bar): The vast majority of drugs cluster in the central range (0.4-0.7). This indicates that hepatotoxicity is rarely a strictly “black-or-white” phenomenon. Instead, it depends on dose, patient genetics, and metabolic pathways.
🔴 The High-Risk Peak: The presence of a relatively high frequency (nearly 10%) around 0.75 (red zone) confirms that hepatic risk is often the “price to pay” for many effective therapies. A drug is not necessarily discarded solely because it shows a DILI signal; rather, the risk is managed—for example, by recommending that clinicians monitor patient transaminase levels.
Whereas neurotoxicity and cardiotoxicity (hERG liability) act as stringent filters—where a positive signal often leads to termination during preclinical development—hepatotoxicity is more frequently regarded as a manageable risk that the pharmaceutical industry is willing to accept. |
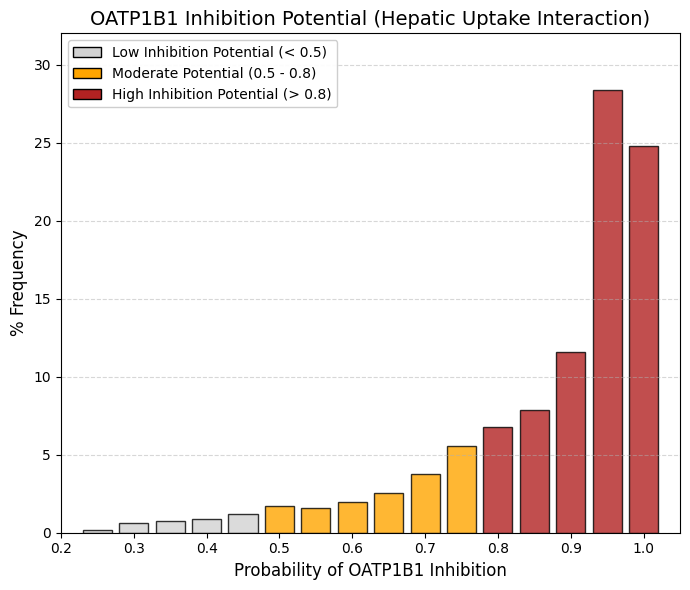
OATP1B1 inhibitor: Organic anionic polypeptide 1B1 inhibitor predictor.
The organic anion transporting polypeptide OATP1B1 is a membrane transporter that facilitates hepatic uptake of drugs, enabling their subsequent conjugation and biliary excretion, a critical step in drug elimination in the human body.
“If it enters, it interferes”: For a drug to be eliminated by the liver, it often must be transported by OATP1B1. If the drug binds to the transporter to enter, it automatically acts as a “competitive inhibitor” for other drugs.
The Successful Drug Profile: As we saw in your previous data (MW, LogP), approved drugs tend to be somewhat lipophilic and moderate in size. Those are exactly the chemical characteristics recognized by OATP1B1.
Risk of Interaction (DDI): This graph clearly shows us that most drugs have the potential to cause interactions. If you take two drugs from this red zone (e.g., a statin and gemfibrozil), they will compete for OATP1B1, one will be left out and cause muscle toxicity. |
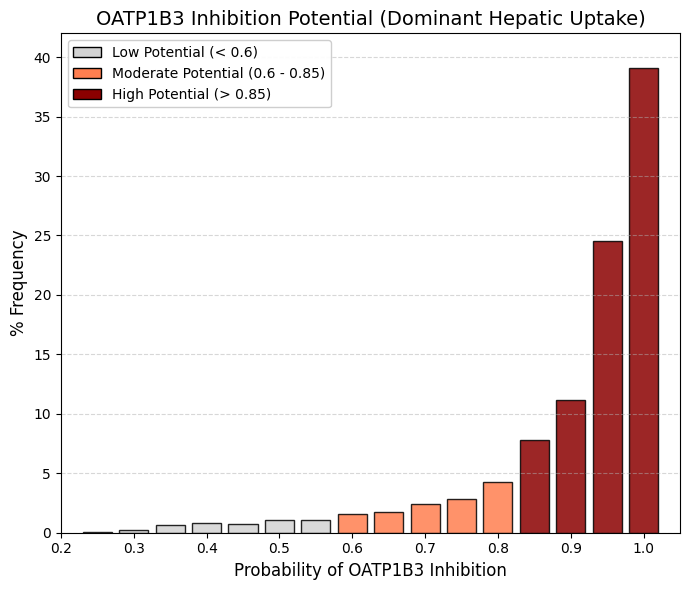
OATP1B3 inhibitor: Organic anionic polypeptide 1B3 inhibitor predictor.
OATP1B1 and OATP1B3 constitute the principal “gateways” for drug entry into the liver and are localized to the sinusoidal (blood-facing) membrane of hepatocytes. Although they share a high degree of sequence identity, OATP1B3 exhibits a broader substrate profile and preferentially accommodates larger and more lipophilic molecules, such as digoxin, paclitaxel, and certain peptide-based drugs, compared with OATP1B1.
The high proportion of drugs testing positive (~75%) can be rationalized mechanistically: for a compound to undergo hepatic elimination—via cytochrome P450-mediated metabolism or biliary excretion—it must first be taken up into hepatocytes. ADMETsar predicts transporter “inhibition,” which at the molecular level reflects binding affinity to the transporter. Consequently, compounds that bind efficiently to gain hepatic entry may be classified as strong competitors and thus appear as inhibitors in in silico predictions. |
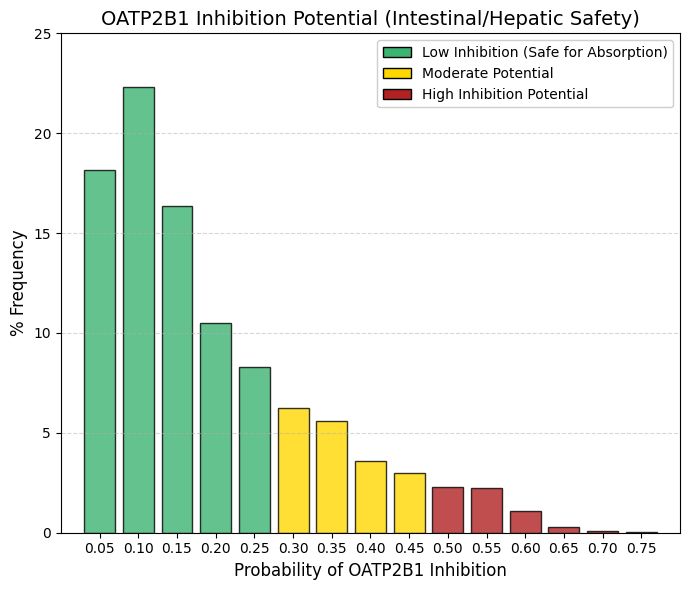
OATP2B1 inhibitor: Organic anionic polypeptide 2B1 inhibitor predictor.
Intestinal OATP2B1 facilitates the uptake of drugs and dietary nutrients from the intestinal lumen into the systemic circulation. The design of compounds that strongly inhibit OATP2B1 carries the risk of impairing nutrient absorption and precipitating complex gastrointestinal drug-drug interactions, thereby altering the oral bioavailability of co-administered therapies.
In contrast to the liver -where hepatic uptake is desirable to enable metabolism and elimination- intestinal transport processes must remain unobstructed to ensure efficient absorption. Accordingly, successful orally administered drugs tend to avoid significant inhibition of OATP2B1, thereby preserving predictable pharmacokinetics and minimizing adverse gastrointestinal effects. |
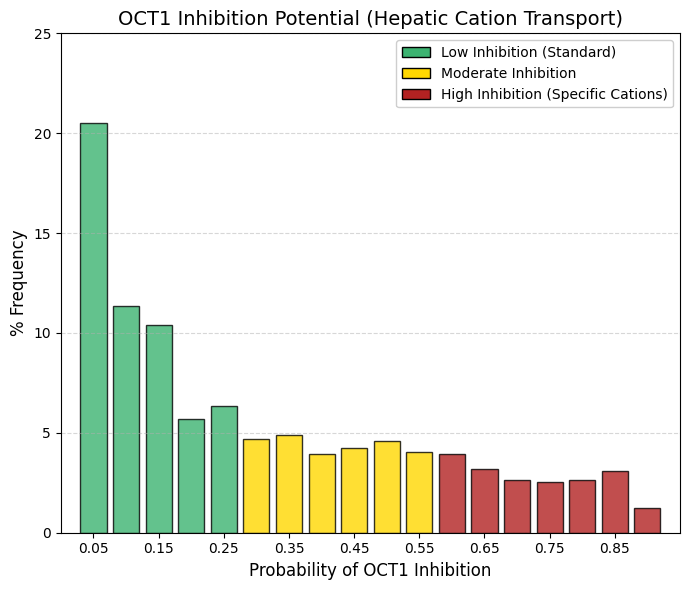
OCT1 inhibitor: Organic cation transporter 1 inhibitor predictor.
Whereas OATP1B1/1B3 (anion transporters) show a pronounced accumulation toward the high-interaction region, OCT1 (a cation transporter) is heavily skewed toward the low-interaction end of the distribution. Approximately 42% of drugs exhibit a very low probability (< 0.15) of inhibiting OCT1. Although the distribution displays a long, shallow tail, it lacks a distinct high-interaction peak. This pattern highlights the chemical selectivity of hepatic uptake mechanisms. OCT1 primarily transports small, often hydrophilic, positively charged organic cations, such as metformin and morphine. In contrast, as demonstrated in the LogP analysis, most successful drugs are predominantly lipophilic. Such compounds can access hepatocytes via passive diffusion or OATP-mediated transport and therefore neither rely on nor substantially inhibit OCT1 to the same extent as anionic drugs.
As a consequence of reduced competition at this transporter, the statistical risk of OCT1-mediated drug-drug interactions is lower than that associated with OATP1B1-mediated interactions. |
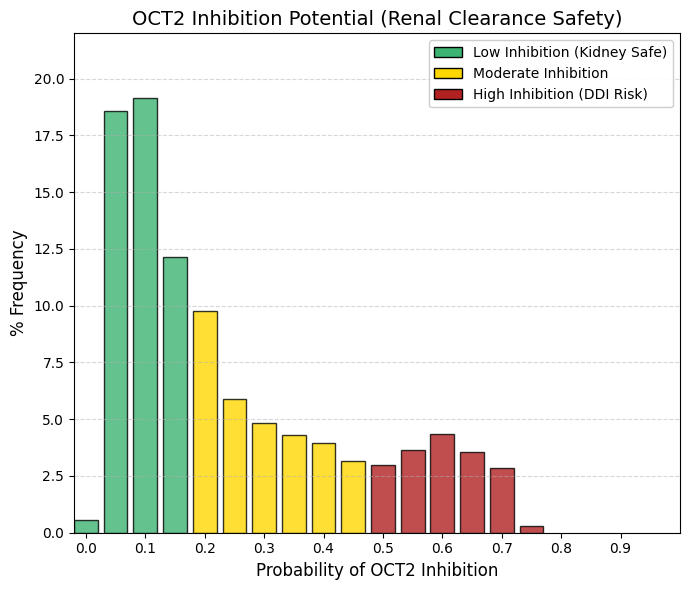
OCT2 inhibitor: Organic cation transporter 2 inhibitor predictor.
OCT2 is expressed on the basolateral membrane of proximal renal tubule cells, where it mediates the uptake of organic cations from the blood into tubular epithelial cells, constituting the primary renal secretory pathway for cationic drugs and endogenous toxins. Inhibition of OCT2 impairs renal clearance by preventing the efficient elimination of co-administered substrates.
For example, cimetidine is a known OCT2 inhibitor and reduces the renal elimination of drugs such as metformin or procainamide, thereby increasing systemic exposure and the risk of toxicity. Consequently, pharmaceutical development programs preferentially advance compounds that do not significantly inhibit this critical transporter, in order to minimize the potential for cumulative renal toxicity and clinically relevant drug-drug interactions. |
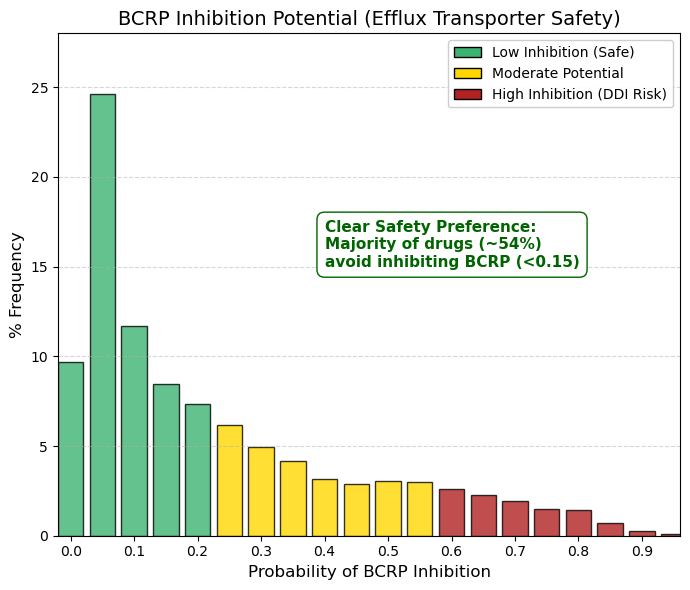
BCRP inhibitor: Breast cancer resistant protein inhibitor predictor.
As observed for renal organic cation transporters (OCTs) and intestinal absorption via OATP2B1, the distribution here is strongly left-skewed. The primary peak occurs at 0.05 (24.6%), and cumulative values from 0 to 0.15 account for approximately 54% of the dataset. Thus, more than half of approved drugs exhibit no or only a very low propensity to inhibit the breast cancer resistance protein (BCRP).
BCRP, encoded by the ABCG2 gene, functions as an ATP-dependent efflux transporter that actively expels substrates from cells. It plays a critical protective role at key biological barriers, including the blood-brain barrier, testes, and placenta, by limiting tissue exposure to xenobiotics. Inhibition of BCRP can lead to the accumulation of co-administered drugs —such as statins or chemotherapeutic agents— to potentially toxic levels.
Accordingly, these data indicate that pharmaceutical discovery programs deliberately avoid designing compounds that inhibit BCRP. In contrast to hepatic OATPs, where transporter interaction is frequently tolerated or even desirable, BCRP inhibition is generally regarded as a safety liability. |
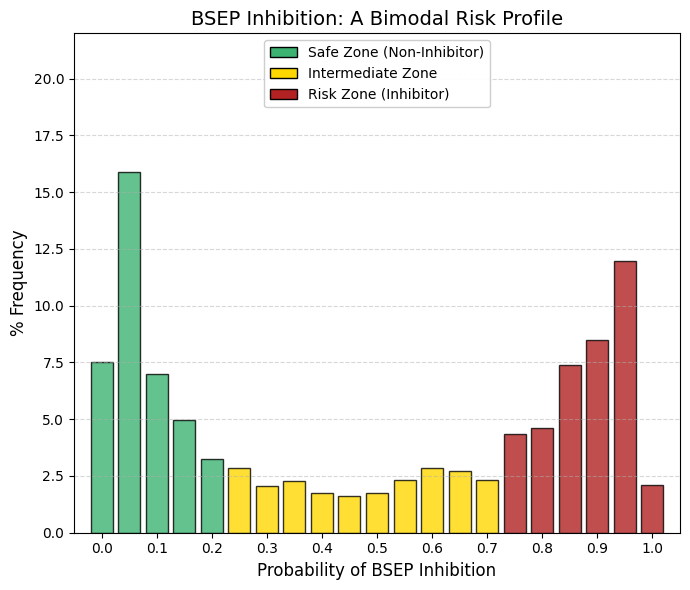
BSEP inhibitor: Bile acid salt efflux pump inhibitor predictor.
In contrast to pure toxicity endpoints (such as hERG liability or AMES mutagenicity) where approved drugs overwhelmingly cluster at the low-risk (left) end of the distribution, and transport-related parameters such as OATPs, which tend to accumulate at the high-interaction (right) end, BSEP displays a strikingly bimodal pattern among approved drugs.
The low-risk group (left): A pronounced peak is observed at approximately 0.05, indicating that roughly 30% of approved drugs exhibit minimal or no interaction with this critical transporter.The “valley of death” (center): Very few compounds show intermediate levels of BSEP interaction, suggesting limited pharmacological space for partial inhibition. The high-risk group (right): A second, substantial peak appears between 0.85 and 0.95. When considering the high-risk region (>0.75), nearly 35-40% of approved drugs demonstrate a strong likelihood of BSEP inhibition.
BSEP (bile salt export pump) is the primary transporter responsible for the canalicular efflux of bile salts from hepatocytes into bile. Its inhibition leads to intracellular bile acid accumulation and can precipitate cholestatic liver injury. Structurally, BSEP possesses a large, lipophilic substrate-binding pocket. While lipophilicity is a common and often necessary feature of successful drugs to enable cellular entry, this same property predisposes many compounds to unintended binding and inhibition of BSEP.
Collectively, these data identify BSEP inhibition as an “Achilles’ heel” of modern pharmacology. Numerous clinically successful agents—including statins, antidiabetic drugs, and certain antibiotics—are known BSEP inhibitors and therefore require hepatic monitoring in clinical use. Although drug discovery efforts attempt to favor compounds in the low-interaction regime, complete avoidance of BSEP inhibition is frequently incompatible with maintaining therapeutic efficacy, as reflected by the persistent high-risk peak. |
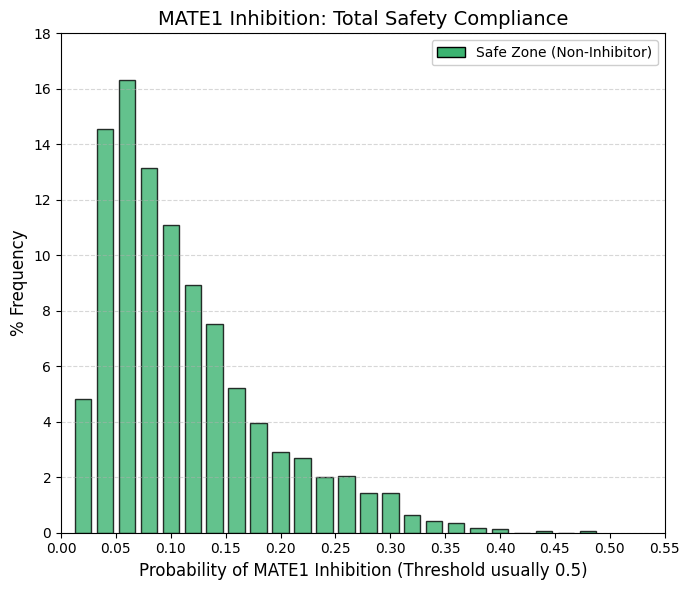
MATE1 inhibitor: Multidrug and toxin efflux transporter 1 inhibitor predictor.
The distribution terminates at 0.48. Given that probabilistic models such as ADMETsar typically define transporter inhibition using a threshold of 0.5 (50%), these data indicate that virtually no approved drug is a potent inhibitor of MATE1. MATE1 functions as the functional counterpart of OCT2 in renal drug handling.
OCT2 (uptake) mediates the transport of cationic drugs from the bloodstream into proximal tubular cells, whereas MATE1 (efflux) exports these compounds from the cells into the tubular lumen for urinary excretion. When a drug is efficiently taken up via OCT2 but inhibits MATE1, intracellular efflux is impaired, leading to accumulation within renal epithelial cells, elevated intracellular concentrations, and subsequent nephrotoxicity.
Consistent with this mechanistic liability, pharmaceutical development programs have learned to stringently avoid MATE1 inhibition. As a result, MATE1 acts as an almost absolute safety filter: compounds that significantly block this efflux pathway are rarely, if ever, advanced to approval due to unacceptable renal toxicity risk. |
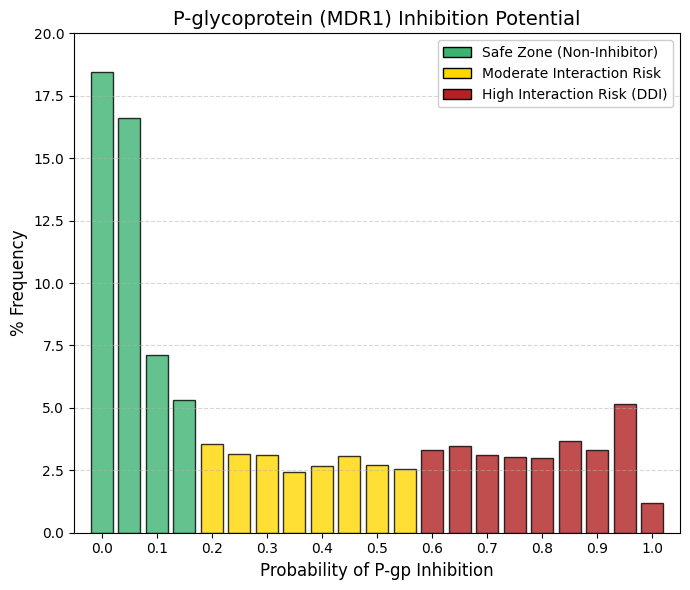
Pgp inhibitor: P-glycoprotein inhibitor predictor.
Similar to other efflux transporters such as BCRP and MATE1, P-glycoprotein (P-gp) exhibits a right-skewed, approximately exponential distribution. However, a key distinction is the presence of a heavier and more persistent high-interaction tail compared with MATE1.
Safety zone (< 0.1): Aggregating the bins at 0, 0.05, and 0.1 accounts for approximately 42% of approved drugs, indicating that nearly half of marketed compounds exhibit minimal or no P-gp inhibition. Persistent tail: In contrast to MATE1, whose distribution rapidly approaches zero, P-gp displays a relatively constant frequency (≈2.5-3.5%) across a broad interaction range (0.2-0.9). This pattern reflects the fact that P-gp inhibition is a frequent and often unavoidable property of large, lipophilic molecules.
P-gp is highly expressed at the blood-brain barrier, where it actively limits neuronal exposure by exporting xenobiotics from the brain. Inhibition of P-gp compromises this protective function, effectively removing a critical barrier to central nervous system entry. Consequently, co-administered drugs that are P-gp substrates—such as digoxin—may accumulate to toxic concentrations. Clinically, macrolide antibiotics such as clarithromycin exemplify this risk through their inhibitory effects on P-gp, which can precipitate digoxin toxicity.
From a drug development perspective, avoidance of P-gp inhibition is preferred, as reflected by the left-hand peak of the distribution. Nevertheless, partial inhibition, represented by the extended tail, is often tolerated when the therapeutic benefit is substantial, provided that the interaction risk is well characterized and clearly communicated in clinical use. |
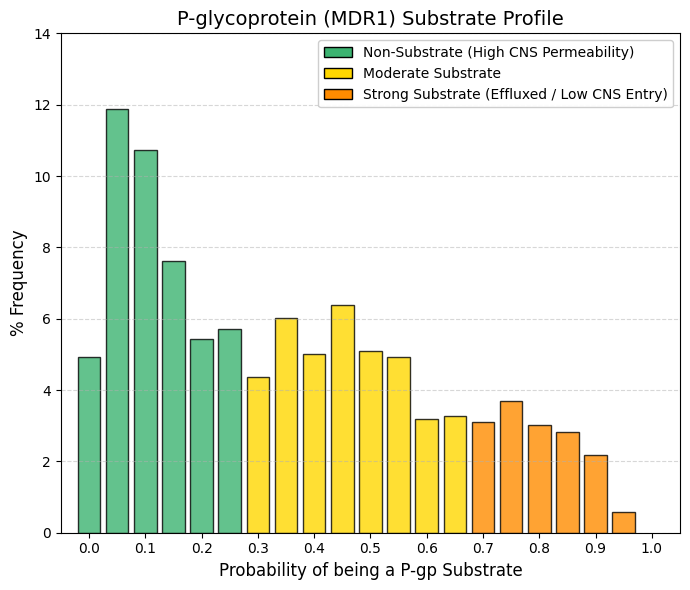
Pgp substrate: P-glycoprotein substrate predictor.
Whereas inhibition of P-glycoprotein (P-gp) primarily constitutes a toxicity risk for co-administered drugs, being a P-gp substrate directly influences the efficacy and tissue distribution of the drug itself. High-permeability group (< 0.2): Aggregation of the lowest bins accounts for approximately 35-40% of approved drugs. These compounds effectively “fly under the radar” of P-gp and are not efficiently recognized or expelled by the transporter. Central plateau (0.2-0.6): Across this range, the frequency remains relatively constant (≈5-6%), indicating that moderate P-gp substrate behavior is common and not intrinsically detrimental. The clinical relevance of P-gp substrate status is therefore context dependent.
For central nervous system (CNS) indications, such as brain infections or depression, strong P-gp substrate properties are incompatible with efficacy, as active efflux at the blood-brain barrier prevents sufficient drug accumulation in the brain. Conversely, for peripherally acting therapies, such as non-sedating antihistamines (e.g., loratadine), P-gp substrate behavior is desirable, as it limits CNS penetration and minimizes neurological side effects. At the intestinal level, P-gp reduces oral absorption by exporting substrates back into the lumen, whereas at the blood-brain barrier it serves a protective role by restricting xenobiotic entry into the brain. Accordingly, drugs intended for CNS activity must reside on the low-substrate end of the distribution, whereas peripherally acting drugs can tolerate or even benefit from higher P-gp substrate liability, thereby enhancing safety by reducing central exposure. |
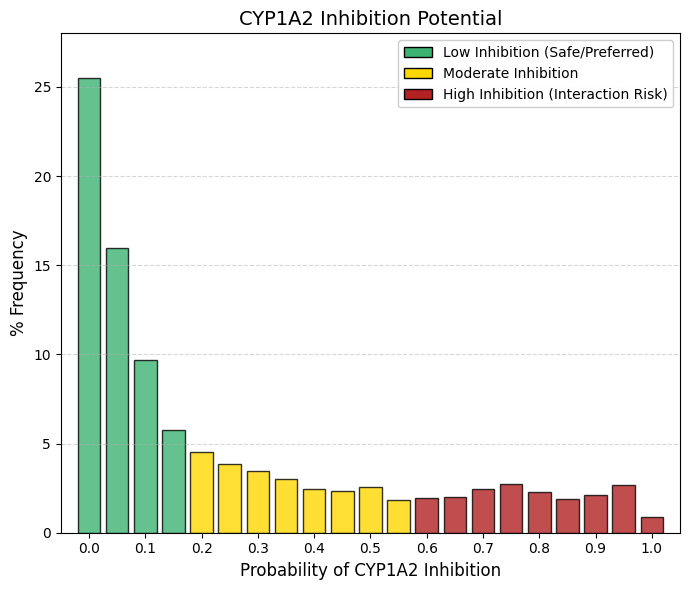
CYP1A2 inhibitor: CYP1A2 inhibitor predictor.
As observed for renal efflux transporters such as MATE1 and for stringent cardiac safety endpoints, the distribution of CYP1A2 inhibition probabilities is strongly right-skewed. The safety wall: The most prominent feature is bin 0, which accounts for 25.5% of approved drugs, indicating that one in four compounds has essentially no likelihood of inhibiting CYP1A2. When probabilities up to 0.15 are aggregated, approximately 57% of drugs fall within a low-risk inhibition zone. The remaining compounds form a long, shallow tail, with low but relatively constant frequencies (≈2-3% per bin) extending across higher probability values.
CYP1A2 is a clinically relevant hepatic cytochrome P450 enzyme, although it is less abundant than CYP3A4. Its substrates include caffeine, theophylline, melatonin, and several widely used psychotropic agents, such as clozapine and olanzapine. Inhibition of CYP1A2 can therefore impair caffeine clearance, leading to symptoms such as nervousness or tachycardia after minimal intake, and, more critically, can precipitate toxic accumulation of antipsychotic drugs.
Structurally, the active site of CYP1A2 is relatively flat and narrow, conferring a preference for planar, polycyclic aromatic substrates. In contrast, contemporary drug design increasingly favors three-dimensional, sp³-rich molecular architectures to enhance solubility and developability. As a result, modern drug candidates tend to be intrinsically mismatched to the CYP1A2 binding pocket. Consequently, CYP1A2 inhibition is minimized not only for safety considerations, but also as a natural outcome of prevailing structural design principles that yield more globular molecules with reduced affinity for this planar enzyme. |
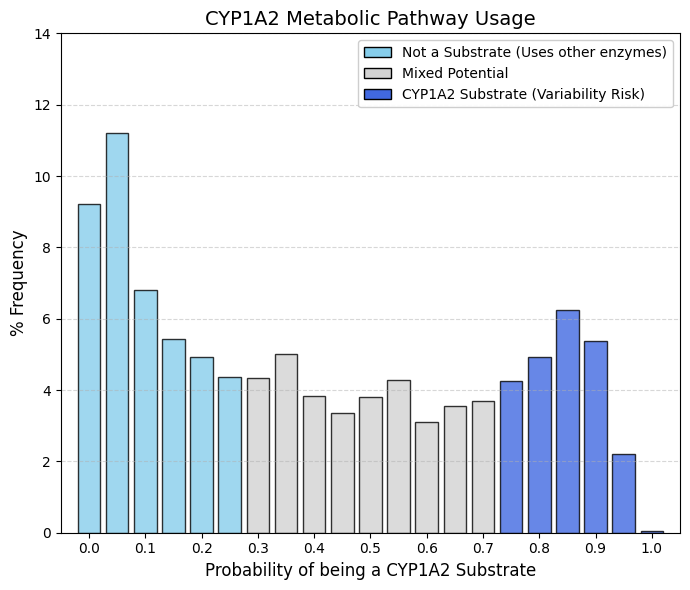
CYP1A2 substrate: CYP1A2 substrate predictor.
Whereas drug discovery efforts actively minimize CYP1A2 inhibition to avoid clinically relevant drug-drug interactions, the corresponding substrate profile is considerably more permissive and broadly distributed. Non-substrate peak (left): Approximately 32% of approved drugs fall below a probability of 0.2, indicating that they are not appreciably metabolized by CYP1A2. Central plateau: The mid-range of the distribution is wide and relatively flat, reflecting the fact that moderate CYP1A2 substrate liability is common and generally acceptable. Substrate group (right): A pronounced increase is observed at high probabilities (>0.8), encompassing approximately 16-17% of drugs that are clearly metabolized by CYP1A2.
The structural basis for this pattern lies in the unusually narrow and planar active site of CYP1A2, which preferentially accommodates flat, aromatic substrates such as caffeine and theophylline. Consequently, many contemporary drug molecules, designed to be more three-dimensional and globular, are intrinsically poor CYP1A2 substrates and therefore populate the low-probability region of the distribution.
When a drug is intentionally or unavoidably designed as a CYP1A2 substrate, clinically relevant sources of variability must be anticipated. Induction of CYP1A2 by tobacco smoking can markedly accelerate drug clearance and reduce therapeutic exposure, while dietary components such as cruciferous vegetables (e.g., broccoli or Brussels sprouts) exert similar inductive effects. In addition, caffeine competes for the same metabolic pathway. Thus, although CYP1A2 substrate status is not inherently disqualifying, it introduces additional clinical “noise.” For this reason, alternative metabolic routes, most notably CYP3A4, are generally preferred when feasible, although reliance on CYP1A2 metabolism remains unavoidable for certain therapeutic classes, particularly psychotropic agents and some analgesics. |
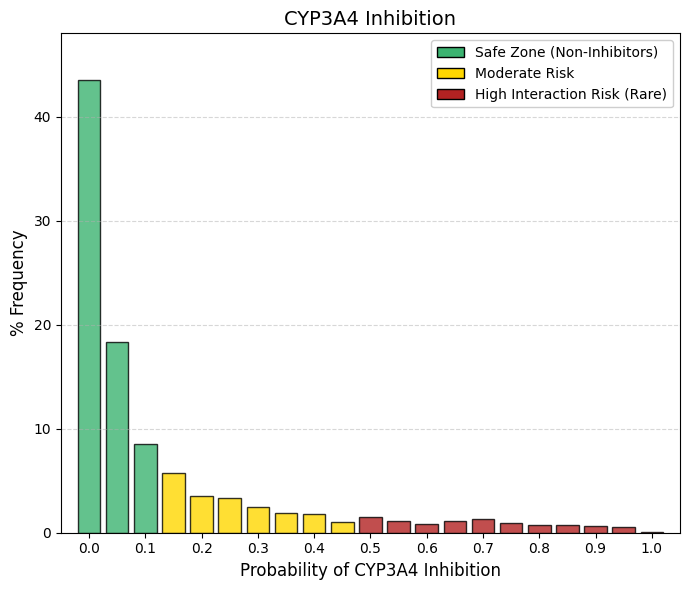
CYP3A4 inhibitor: CYP3A4 inhibitor predictor.
CYP3A4 is the predominant drug-metabolizing enzyme in humans, responsible for the biotransformation of approximately 50% of marketed drugs. A pronounced “safety wall” is evident at low inhibition probabilities: summing bins 0 and 0.05 (43.5% and 18.3%, respectively) indicates that roughly 62% of approved drugs have an almost negligible likelihood of inhibiting this enzyme. In comparison with CYP1A2—which already exhibited a conservative inhibition profile—CYP3A4 is subject to even stricter avoidance. The high-probability tail essentially vanishes, and beyond a probability of 0.5 the frequency drops below 1%, underscoring the industry’s near-absolute intolerance of CYP3A4 inhibition. The clinical rationale for this stringency is clear: inhibition of CYP3A4 compromises the clearance of a wide range of essential medications, including statins, benzodiazepines, anticoagulants, and antiretroviral agents. Such interactions can result in dramatic increases in systemic drug exposure, leading to severe adverse effects, exemplified by statin-induced rhabdomyolysis.
Consequently, a drug candidate that is identified as a potent CYP3A4 inhibitor is highly unlikely to progress to regulatory approval, reflecting CYP3A4’s role as one of the most stringent metabolic safety filters in modern drug development. |
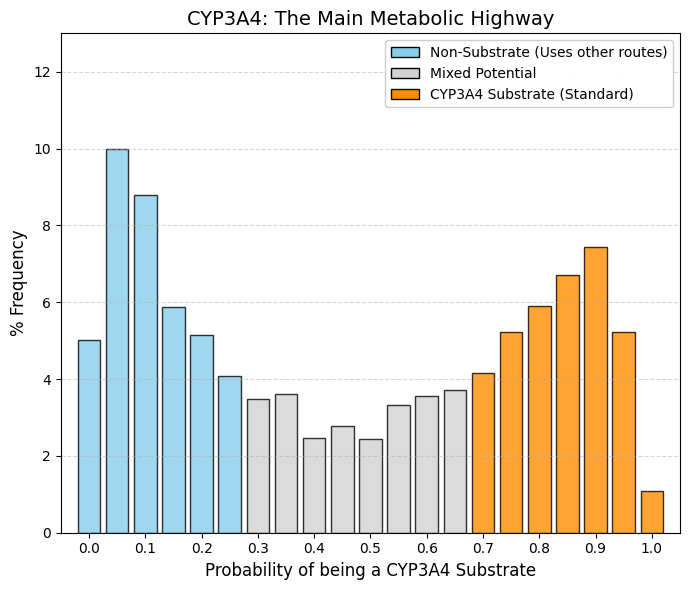
CYP3A4 substrate: CYP3A4 substrate predictor.
Whereas drug discovery programs rigorously exclude CYP3A4 inhibition, substrate liability for this enzyme is widely accepted. The resulting distribution is therefore bimodal. Left peak (non-substrates, ~30%): This group comprises predominantly hydrophilic drugs that are eliminated unchanged via renal excretion or are cleared through more selective metabolic pathways, such as CYP2D6. Right peak (substrates, ~35-40%): A pronounced accumulation is observed at high substrate probabilities (0.7-0.95), reflecting a substantial fraction of marketed drugs that are efficiently metabolized by CYP3A4. This pattern arises from the exceptional catalytic “promiscuity” of CYP3A4, which possesses a large, flexible active site capable of accommodating structurally diverse, bulky, and lipophilic molecules. Lipophilicity is often a prerequisite for oral bioavailability and cellular uptake; however, the same property makes compounds readily recognizable by CYP3A4.
Drug design must therefore navigate an inherent trade-off. Compounds can be engineered to resist CYP3A4-mediated metabolism to prolong systemic exposure, or CYP3A4 clearance can be accepted, with therapeutic efficacy maintained through appropriate dose and dosing frequency adjustments. As a result, a substantial proportion of approved drugs are intentionally or unavoidably substrates of CYP3A4, reflecting its central role in human xenobiotic metabolism. |
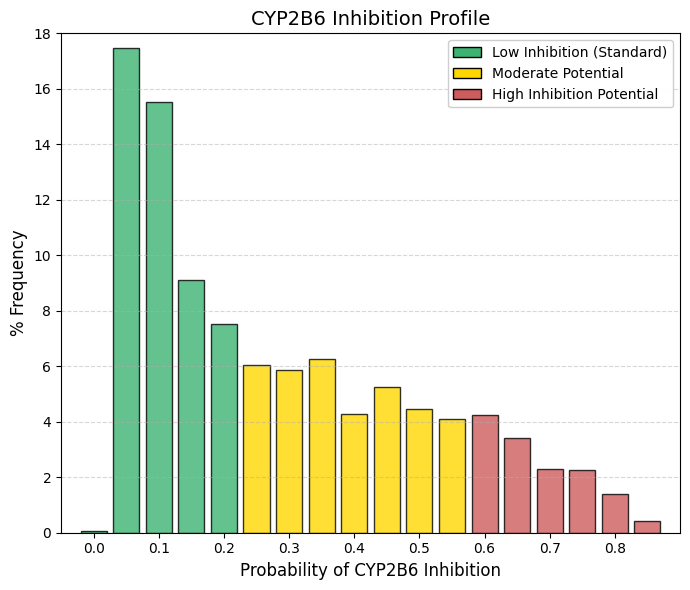
CYP2B6 inhibitor: CYP2B6 inhibitor predictor.
The inhibition profile of CYP2B6 closely resembles that of CYP1A2, albeit with a subtle but informative distinction at the lower end of the distribution. Unlike other safety-related parameters, where bin 0 is dominant, CYP2B6 shows a negligible frequency at bin 0 (0.08%). Instead, the largest accumulation occurs immediately at low but nonzero probabilities (0.05 and 0.1), which together account for nearly 33% of approved drugs. The distribution then declines gradually, such that cumulative probabilities up to 0.35 encompass approximately 65-70% of compounds. Thus, while most drugs exhibit a low likelihood of inhibiting CYP2B6, true zero-risk profiles are uncommon.
Although CYP2B6 contributes to the metabolism of only a small fraction of marketed drugs (approximately 2-5%), its role is clinically critical for several high-impact therapies, including efavirenz (HIV treatment), bupropion (antidepressant and smoking cessation aid), methadone, and the anesthetic propofol.
Because CYP2B6 is not a dominant clearance pathway for the majority of drug candidates, medicinal chemistry programs typically do not apply strong selective pressure to eliminate CYP2B6 interactions, in contrast to stringent optimization against liabilities such as hERG blockade or CYP3A4 inhibition. The resulting distribution therefore reflects a largely unforced chemical landscape: most compounds simply exhibit poor complementarity with the CYP2B6 active site, leading to generally low levels of inhibition without the need for aggressive structure-based avoidance strategies. |
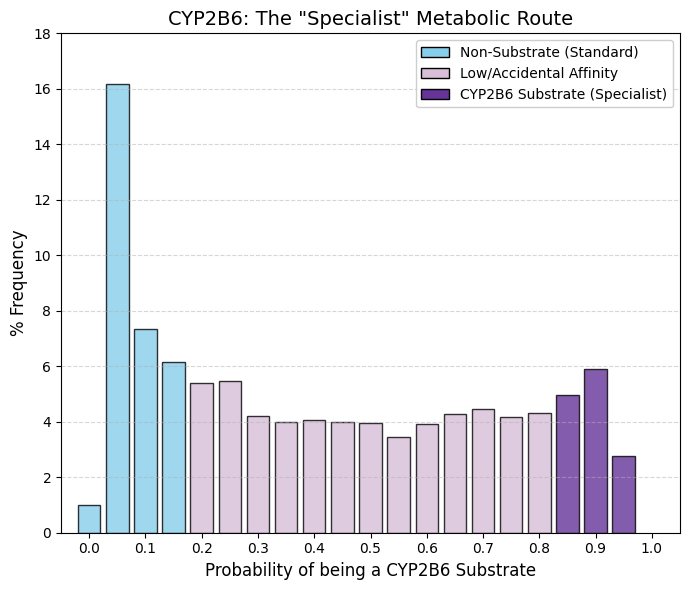
CYP2B6 substrate: CYP2B6 substrate predictor.
A pronounced peak is observed at bin 0.05 (16.18%), and when adjacent bins are included, the data indicate that for approximately 30% of approved drugs CYP2B6 is functionally irrelevant. In contrast to other inhibition profiles that decay toward zero at higher probabilities or exhibit a pronounced rebound at the upper end (as seen for CYP3A4), this distribution remains relatively flat across the entire range, with a nearly constant frequency of approximately 4-5%. This pattern confirms that CYP2B6 is not a preferred metabolic pathway for the majority of drugs. CYP2B6 is a quantitatively minor hepatic enzyme, with substantially lower expression levels than CYP3A4 or CYP1A2. As a result, drug candidates are rarely designed to rely on CYP2B6-mediated clearance, as this pathway would be readily saturable. The observed flat plateau suggests that many compounds display incidental or moderate affinity for CYP2B6, while relatively few act as dominant or exclusive substrates.
The clinical relevance of CYP2B6 arises from its role in the metabolism of a limited but important set of drugs, including cyclophosphamide (oncology), efavirenz (HIV therapy), and methadone. Outside of these therapeutic classes, most drugs are unlikely to depend on CYP2B6 as a primary route of elimination. |
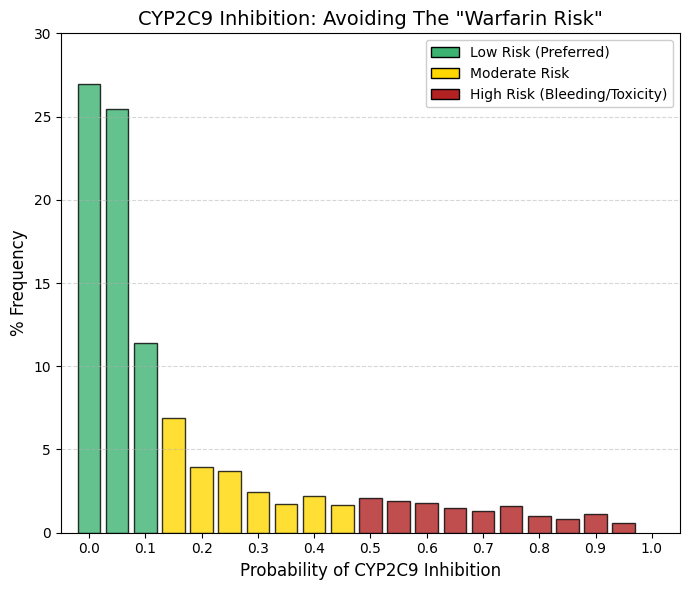
CYP2C9 inhibitor: CYP2C9 inhibitor predictor.
As observed for CYP3A4, the inhibition profile of CYP2C9 exhibits a pronounced exponential decline. Summation of the first three bins (26.9%, 25.4%, and 11.4%) indicates that approximately 64% of approved drugs have a zero or negligible probability of inhibiting CYP2C9. Beyond a probability of 0.2, the frequency drops below 4% and continues to decrease steadily across higher bins.
From a drug design perspective, inhibition of CYP2C9 is actively avoided, given the enzyme’s central role in the metabolism of clinically critical agents such as warfarin and sulfonylureas. Warfarin, in particular, has a very narrow therapeutic index; inhibition of CYP2C9 can markedly impair its clearance, leading to excessive anticoagulation and a high risk of severe internal bleeding.
In addition, several widely used nonsteroidal anti-inflammatory drugs (NSAIDs), including ibuprofen and diclofenac, are CYP2C9 substrates. Co-administration with potent CYP2C9 inhibitors can increase systemic exposure to these agents and exacerbate their gastrointestinal toxicity. Accordingly, except in highly justified and carefully managed cases, new drug candidates are designed to avoid significant CYP2C9 inhibition in order to minimize drug-drug interactions involving cardiovascular therapies and commonly used analgesics. |
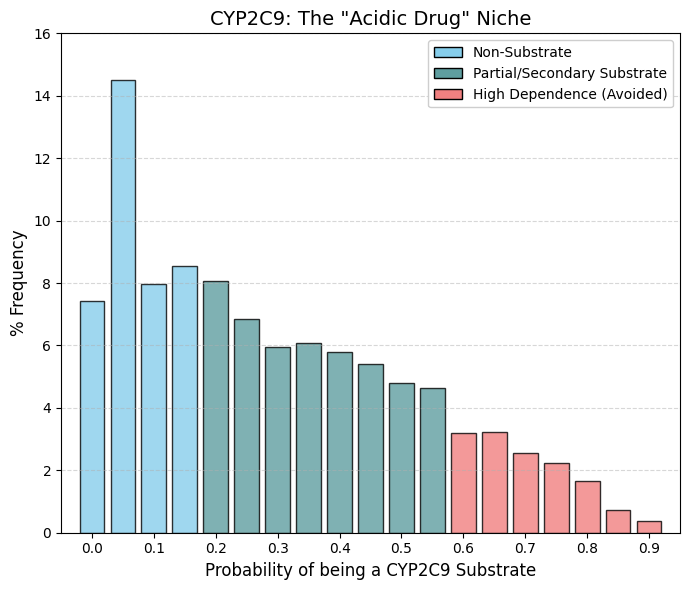
CYP2C9 substrate: CYP2C9 substrate predictor.
A striking contrast is observed when comparing this profile with that of CYP3A4, which displayed a characteristic U-shaped distribution. In the case of CYP2C9, the substrate distribution is right-skewed with a pronounced central “bulge.” Approximately 22% of approved drugs (bins 0 and 0.05) are not substrates of CYP2C9. In contrast, a high density of compounds populates the intermediate probability range (0.1-0.5), indicating that many drugs undergo partial metabolism by CYP2C9 without relying on it as an exclusive clearance pathway. Unlike CYP3A4, where a distinct high-probability peak is observed, the frequency here declines sharply beyond 0.7, and very few contemporary drugs appear to depend predominantly on CYP2C9-mediated metabolism.
This pattern reflects the well-defined chemical selectivity of CYP2C9, which preferentially metabolizes weak acids and molecules containing specific polar functional groups. Representative substrates include nonsteroidal anti-inflammatory drugs such as ibuprofen and diclofenac, as well as antidiabetic agents like glibenclamide. Compounds lacking acidic character rarely engage this enzyme, accounting for the substantial non-substrate population at the low-probability end of the distribution.
The paucity of high-probability substrates is further explained by the pronounced genetic polymorphism of CYP2C9. A significant fraction of the population, particularly among individuals of European ancestry, carries reduced-function (“slow metabolizer”) alleles. Drugs that depend almost exclusively on CYP2C9 for clearance (probabilities >0.9) would therefore pose a substantial overdose risk in these patients. Consequently, CYP2C9 is generally utilized as a secondary or shared metabolic pathway, and modern drug design deliberately avoids exclusive reliance on this enzyme. |
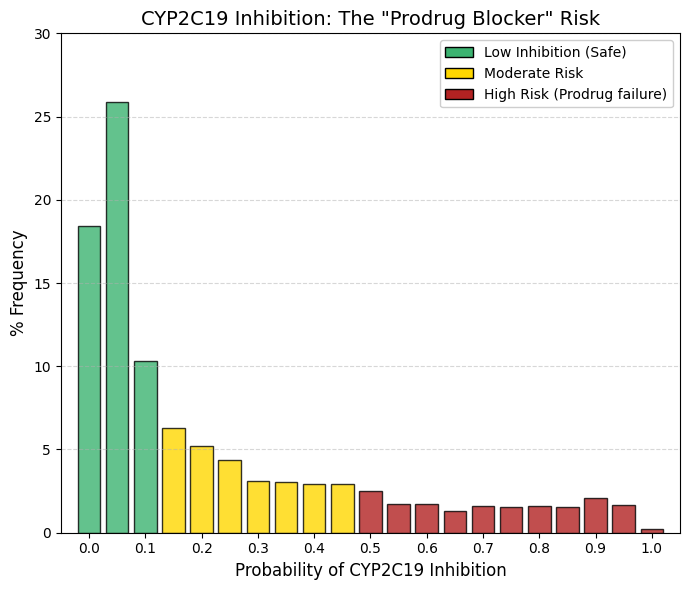
CYP2C19 inhibitor: CYP2C19 inhibitor predictor.
The observed distribution again follows an exponential decay, closely resembling the inhibition profiles of CYP3A4 and CYP2C9, but with a clinically distinctive feature. A large safety zone is evident in the lowest bins (0-0.05): summing 18.4% and 25.9% indicates that approximately 44% of marketed drugs are essentially unaffected by CYP2C19-mediated metabolism. By bin 0.2, the cumulative frequency already encompasses the vast majority of compounds. Unlike CYP3A4, where the distribution tail nearly vanishes, the CYP2C19 curve maintains a persistent low, level “background” of approximately 1.5-2% across the higher probability range. This suggests that it is intrinsically more difficult to design molecules that are completely inert toward CYP2C19, although medicinal chemistry efforts consistently aim to minimize such interactions.
The clinical relevance of CYP2C19 inhibition is unusual in that it is driven primarily by prodrug activation rather than by impaired clearance. A paradigmatic example is clopidogrel (Plavix), an essential antiplatelet agent that is pharmacologically inactive until bioactivated by CYP2C19. Co-administration of a CYP2C19 inhibitor with clopidogrel can severely reduce its conversion to the active metabolite, leading to therapeutic failure, increased platelet aggregation, and a heightened risk of myocardial infarction.
This risk is compounded by the high prevalence of CYP2C19 genetic polymorphisms. A substantial proportion of patients are poor metabolizers with intrinsically low CYP2C19 activity. In these individuals, even moderate inhibition can effectively abolish enzymatic function, rendering clopidogrel largely ineffective. For this reason, modern drug development treats CYP2C19 inhibition as a critical liability, particularly for compounds intended for chronic use in cardiovascular populations. |
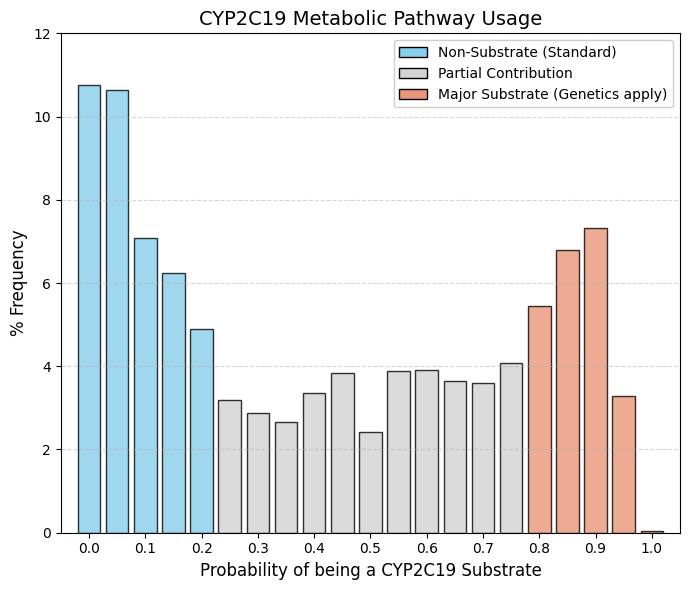
CYP2C19 substrate: CYP2C19 substrate predictor.
As with CYP3A4, the distribution is clearly bimodal, with two well-defined peaks, but with an important distinction: the central “valley” is noticeably shallower. This indicates a larger fraction of drugs with intermediate probabilities of interaction rather than a strict separation between non-substrates and strong substrates. Outlier Group (Bins 0-0.1). Summing the initial bins shows that approximately 28% of marketed drugs exhibit little to no interaction with CYP2C19, forming a substantial non-substrate population. Final Surge (Bins 0.8-0.9). In contrast to CYP2C9, where the right tail collapses, the distribution here rises again toward the end. From bin 0.8 to 0.9, there is sustained growth, reaching 7.3% in bin 0.9. This demonstrates that drugs designed to be strong CYP2C19 substrates are not only tolerated but deliberately accepted in modern pharmacotherapy.
CYP2C19 represents a preferred metabolic route for two major and commercially dominant drug classes. The first is proton pump inhibitors (PPIs) such as omeprazole and pantoprazole. These compounds have wide therapeutic windows and excellent safety profiles, making interindividual variability in CYP2C19 activity clinically manageable. The second class is antidepressants, notably citalopram and escitalopram, which also rely significantly on CYP2C19 for clearance.
Although CYP2C19 is highly polymorphic, encompassing poor, extensive, and ultra-rapid metabolizers, dependence on this pathway is considered acceptable because these drugs generally lack the narrow therapeutic margins seen with CYP2C9 substrates such as warfarin. Consequently, variability in exposure rarely translates into catastrophic toxicity, allowing CYP2C19 to remain a viable and strategically used metabolic route in drug design. |
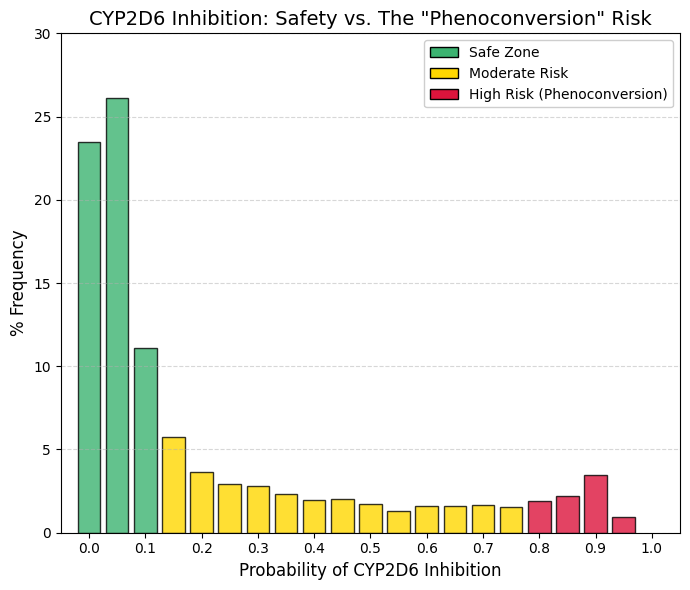
CYP2D6 inhibitor: CYP2D6 inhibitor predictor.
The observed frequency distribution exhibits an exponential decay pattern similar to that of CYP2C9; however, a distinct terminal feature differentiates this enzyme from comparable isoforms. Cumulative analysis of the initial three bins indicates that approximately 60% of the screened compounds exhibit negligible inhibition. In the interval between 0.2 and 0.8, the frequency remains low and stable.Conversely, a significant anomaly is observed in Bin 0.9 (3.44%), characterized by a marked increase from the 1.9% observed at 0.8. This subset corresponds to known potent inhibitors, such as fluoxetine, paroxetine, and quinidine. This finding highlights the clinical risk of phenoconversion. Patients identified as genotypic extensive metabolizers who concomitantly administer a potent inhibitor (Bin >0.9) may exhibit a phenotype functionally equivalent to that of a poor metabolizer. For instance, tamoxifen is a prodrug requiring bioactivation via CYP2D6. Consequently, the presence of a strong inhibitor compromises metabolic activation and therapeutic efficacy. Therefore, compounds falling within the >0.8 range warrant a high-priority warning: 'High Risk: Potential failure of prodrug therapies (e.g., tamoxifen). |
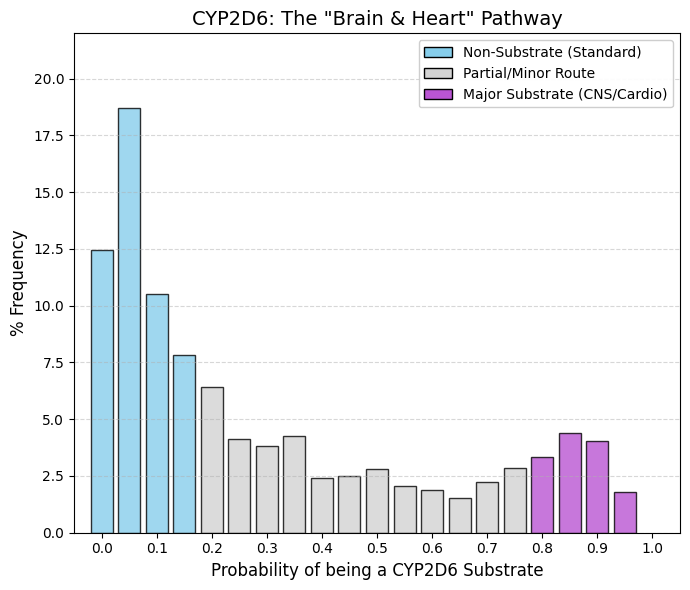
CYP2D6 substrate: CYP2D6 substrate predictor.
In the 0-0.15 range, approximately 50% of screened compounds exhibit negligible affinity for the enzyme; these agents typically possess therapeutic indications unrelated to the Central Nervous System (CNS) or cardiovascular targets. However, the distribution exhibits a distinct elevation in the 0.8-0.95 range, where 12-15% of drugs are identified as substrates. Unlike CYP2C9, where substrate frequency diminishes to near-zero at higher ranges, CYP2D6 retains a robust substrate population.
This phenomenon is driven by structural determinants. CNS penetration generally necessitates lipophilicity and the presence of a basic nitrogen moiety (amine). The catalytic core of CYP2D6 contains an aspartic acid residue that facilitates electrostatic interactions with these basic amines. Consequently, it is challenging to engineer psychotropic agents (e.g., antidepressants or antipsychotics) that achieve CNS penetration without also serving as CYP2D6 substrates. The observed terminal spike, therefore, reflects this structural constraint, representing a niche dominated by psychiatric medications and beta-blockers. |
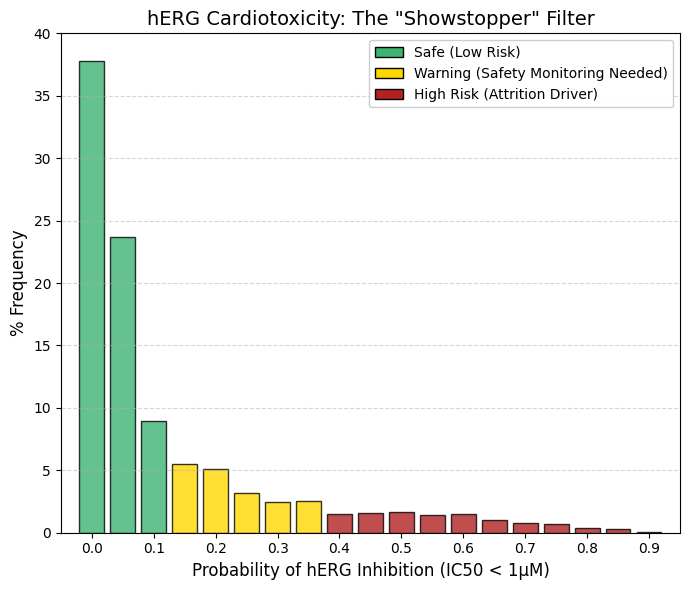
hERG (1 µM): A threshold value of 1 µM was used.
Inhibition of the hERG channel (Kv11.1) is a decisive determinant of compound viability in drug development. Cumulative analysis of the initial bins (0-0.1) reveals that 70.4% of approved drugs exhibit negligible hERG inhibition at 1 µM concentrations. Above a probability threshold of 0.5, the frequency declines to <1.5% and approaches zero. In contrast to CYP inhibition, which can often be managed via dose titration, potent hERG blockade typically necessitates project termination due to the associated risk of fatal arrhythmias. Functionally, hERG mediates cardiac repolarization; blockade delays this 'reset' phase, manifesting clinically as QT interval prolongation. This state creates a window of vulnerability where premature depolarization can trigger Torsades de Pointes, a chaotic polymorphic ventricular tachycardia associated with sudden cardiac death. Structurally, the hERG channel features a voluminous, hydrophobic central cavity that readily accommodates bulky, lipophilic molecules, particularly those containing basic amines. The limited number of compounds occupying the high-risk 'tail' of the distribution are likely restricted to oncology or antiarrhythmic indications, where the risk-benefit profile permits a higher toxicity threshold. Conversely, for indications such as analgesia or anti-infectives, a positive hERG signal is generally considered a definitive 'no-go' criterion. |
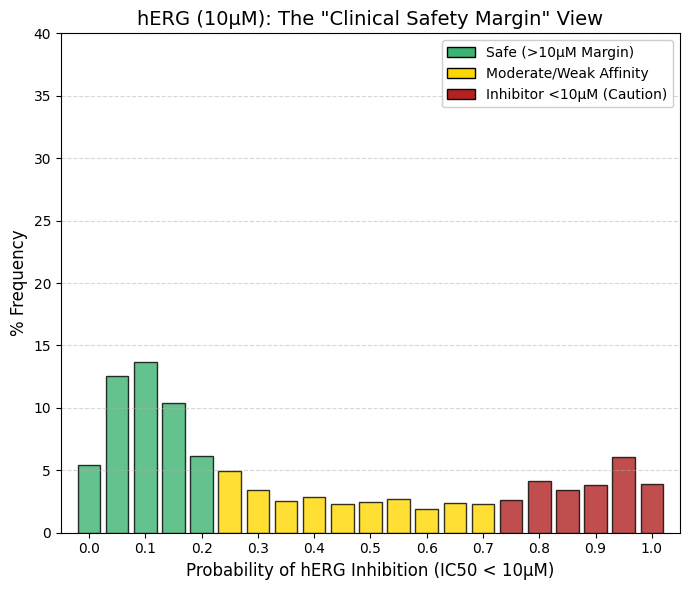
hERG (10 µM): A threshold value of 10 µM was used.
While the hERG inhibition prediction at 1 µM primarily identifies highly potent and potentially lethal compounds, increasing the threshold to 10 µM imposes a more stringent safety criterion and allows the detection of compounds associated with latent cardiotoxic risk. At the 10 µM threshold, the distribution shifts noticeably: fewer drugs populate the leftmost bins compared with the 1 µM graph, while the right-hand tail (bins 0.95-1.0) increases substantially. A considerable number of approved drugs exhibit moderate hERG channel inhibition within the 1-10 µM range. Although these compounds are not immediately life-threatening, their clinical use typically requires QT interval monitoring in hospital settings. The right tail (bins 0.8-1.0) comprises approximately 17% of marketed drugs. These molecules interact measurably with the hERG channel but have nevertheless been approved because their therapeutic benefit outweighs the associated cardiac risk, as exemplified by certain antipsychotics and macrolide antibiotics. From a drug development perspective, compounds that fail the 1 µM criterion are generally discarded, whereas those that pass at 1 µM but fail at 10 µM are classified as requiring caution. |
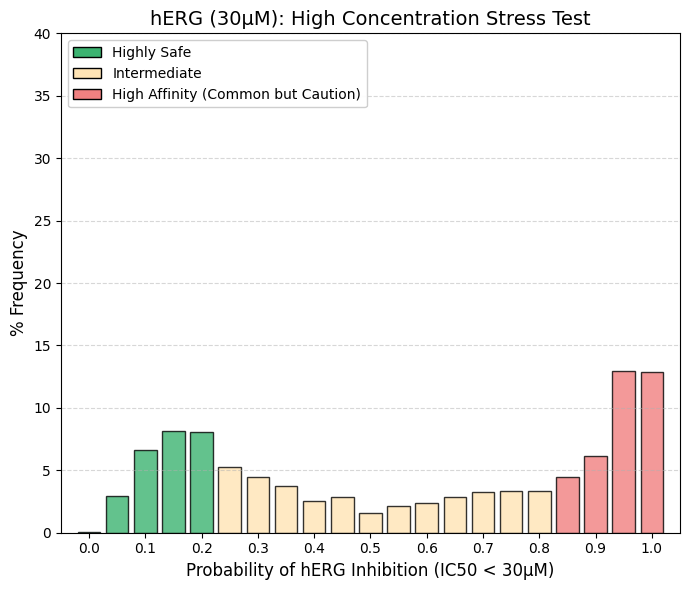
hERG (30 µM): A threshold value of 30 µM was used.
The frequency distribution at 30 µM exhibits a pronounced morphological shift compared to the 1 µM dataset. Whereas the 1 µM distribution was heavily skewed towards the lower quantiles (indicating safety), the 30 µM profile demonstrates a significant rightward shift. At this elevated concentration, cumulative analysis of the upper bins (0.85-1.0) reveals that over 30% of compounds test positive for inhibition, a marked contrast to the negligible activity observed at 1 µM. High-concentration hERG blockade is a frequent phenomenon, often driven by nonspecific interactions involving lipophilic moieties. However, clinical risk is determined by the safety margin rather than absolute potency. For example, a drug with a therapeutic plasma concentration of 0.01 µM that inhibits hERG at 30 µM retains a 3000-fold safety margin, generally considered robust. Conversely, compounds that persist in the lower range (Bins 0-0.2) even at 30 µM are classified as 'hERG-Silent.' These agents represent the optimal safety profile, appearing electrophysiologically inert even at supratherapeutic concentrations. |
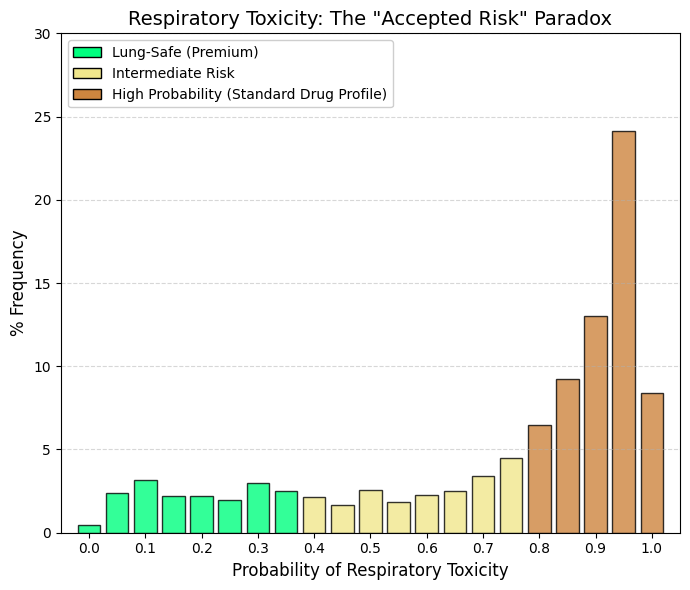
Respiratory toxicity.
In stark contrast to the hERG inhibition profile, which was heavily skewed toward the lower (safe) quantiles, the respiratory toxicity distribution exhibits a pronounced rightward skew. The highest probability bin (0.95) alone accounts for 24.15% of compounds. Cumulative analysis of the bins >0.7 reveals that 60-70% of approved drugs are classified as 'Probably Toxic to the Respiratory System,' whereas less than 5% reside in the minimal risk interval (0-0.2). This distribution likely reflects the broad phenotypic definitions employed by ADMETsar, which encompass endpoints ranging from 'respiratory reactions' to 'respiratory depression'. Numerous therapeutic classes—including opioids, benzodiazepines, antihistamines, and beta-blockers—possess known but clinically manageable pulmonary side effects. Consequently, the model appears to detect any signal of adverse respiratory events within product labeling or pharmacovigilance reports (e.g., cough, mild dyspnea), rather than distinguishing solely for fatal acute toxicity. Given that DrugBank comprises approved therapeutics, the model effectively learns an inherent association between pharmaceutical activity and respiratory liability. Therefore, compounds located in the lower probability zone (<0.3) represent a rare and exceptional subset characterized by a uniquely clean pulmonary safety profile. |
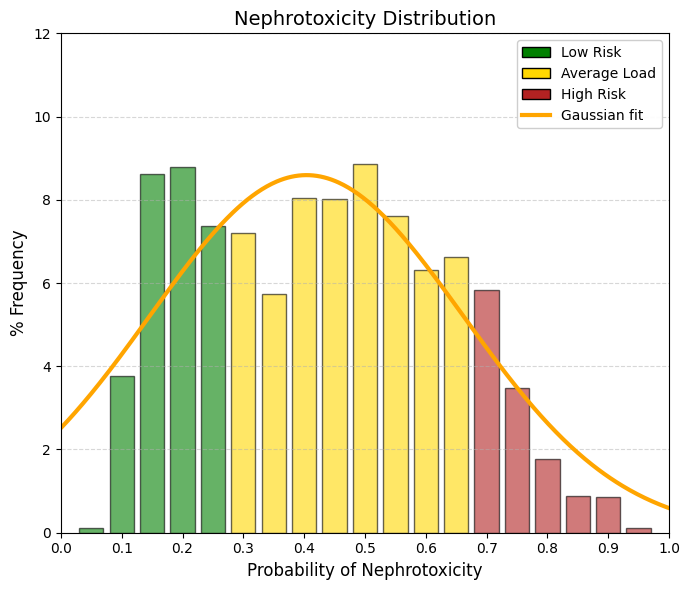
Nephrotoxicity.
The kidney, together with the liver, is one of the two most important excretory organs in the human body. Its primary functions include the reabsorption of water and other essential substances, such as glucose, amino acids, and sodium ions, as well as the production of urine for the elimination of metabolic waste products and toxic compounds. In addition, the kidney regulates the body’s water, electrolyte, and acid-base balance. These renal functions are essential for normal metabolism and for maintaining the stability of the internal environment. However, during these physiological processes, the kidneys are continuously exposed to drugs and chemicals circulating in the bloodstream and are therefore particularly susceptible to drug-induced damage. While the liver primarily metabolizes drugs to increase their water solubility and directs them either to the kidneys for urinary excretion or to the bile for fecal elimination, the kidney filters both unmetabolized and metabolized compounds into the urine. Most drugs cluster in the intermediate range of the distribution, between 0.2 and 0.7. The extremes are sparsely populated: very few drugs can be classified as “non-nephrotoxic” (<0.1) or “highly nephrotoxic” (>0.8), and compounds with pronounced nephrotoxicity, such as aminoglycosides, cisplatin, and high-dose nonsteroidal anti-inflammatory drugs, are well known and clinically feared. A predicted nephrotoxicity probability of 40-50% (corresponding to the center of the graph) does not imply inevitable renal failure; rather, it indicates a tendency for renal accumulation and increased renal workload, which in turn confers a heightened susceptibility to kidney injury. |
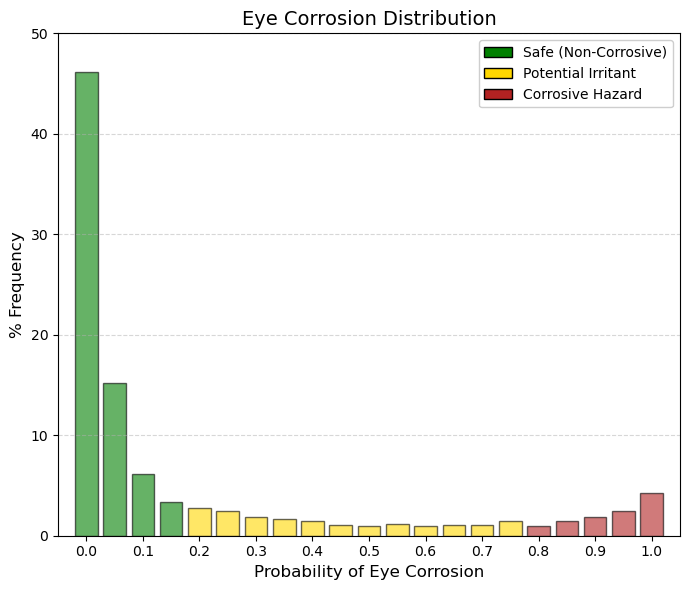
Eye corrosion.
By summing the first three bars (bins 0-0.1), it becomes evident that 67.5% of drugs have an almost negligible probability of causing ocular corrosion. In ADMETsar, this endpoint corresponds to hazard labels H314 (causes severe skin burns and eye damage) and H318 (causes serious eye damage). Importantly, this classification does not refer to mild or reversible irritation (H319), such as transient conjunctival redness, but rather to severe and often irreversible ocular injury. The final group (bin 1.0) comprises 4.25% of drugs that are predicted to be confirmed ocular corrosives. These compounds are likely to include strong acids, strong bases, or highly reactive alkylating agents (e.g., certain chemotherapeutics), all of which require the use of strict personal protective equipment, including safety goggles, during laboratory handling. Eye corrosion is therefore a critical parameter for manufacturing and handling safety. The vast majority of drugs are intentionally designed to be chemically mild and close to physiological pH, which explains the strong left-skewed concentration of the distribution. If a drug is intended for ophthalmic administration and exhibits a high predicted probability of eye corrosion, the development project would be immediately terminated. Even for orally administered drugs, a high score in this parameter would not necessarily halt development, but it would imply a significant occupational hazard for the chemists involved in its synthesis and formulation. |
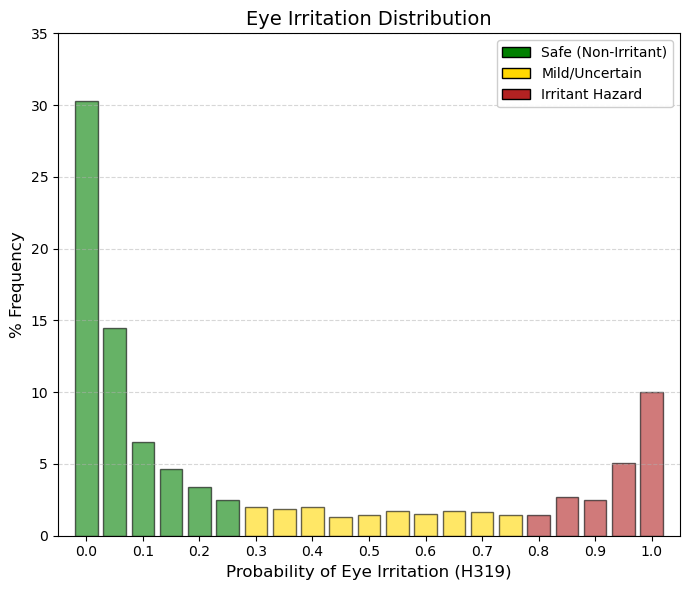
Eye irritation.
Clear distinctions can be observed between ocular corrosion (H314/H318) and ocular irritation (H319). At the extreme right of the distribution (bin 1.0), corrosion accounts for approximately 4.2% of approved drugs listed in DrugBank, whereas ocular irritation encompasses nearly 10%. Thus, it is substantially more common for a drug to be classified as irritating—a reversible and generally manageable effect—than as corrosive, which implies permanent tissue damage. Consistent with this distinction, the proportion of compounds in bin 0 (no interaction) decreases from 46% for corrosion to approximately 30% for irritation, indicating a lower degree of absolute safety with respect to mild ocular effects. Compounds located in the high-probability region (>0.8) are unlikely to be suitable for ophthalmic formulations without specialized buffering systems and would require strict eye protection (e.g., safety goggles) during industrial manufacture. From a regulatory perspective (OECD, EPA, ECHA), ocular corrosion and irritation are clearly differentiated by the criterion of reversibility. Hazard category H318 (Eye Corrosion/Serious Eye Damage) refers to irreversible tissue injury or visual impairment that does not fully resolve within 21 days following exposure. In contrast, H319 (Eye Irritation, Category 2A) is defined by ocular changes—such as conjunctival redness, edema, or corneal opacity—that are fully reversible within 21 days after exposure. |
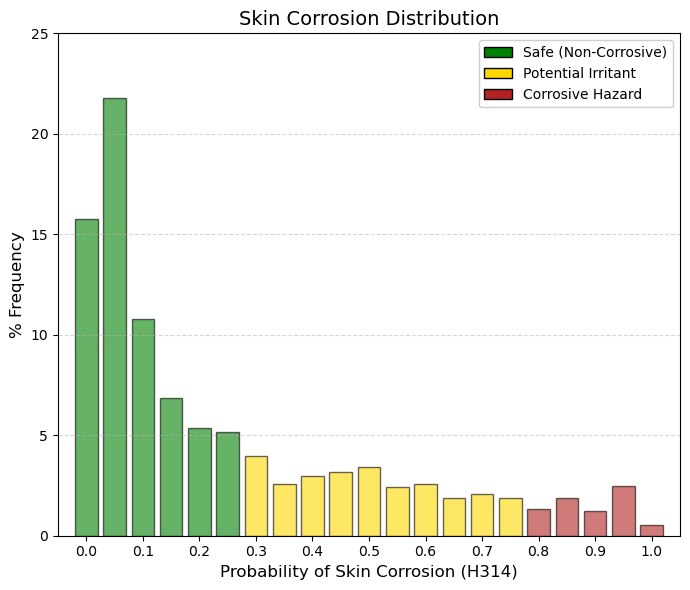
Skin corrosion.
At this point, it is important to emphasize the marked difference relative to ocular irritation, for which approximately 10% of drugs fall into bin 1.0 (maximum predicted toxicity), whereas for skin corrosion only about 0.5% of drugs occupy this extreme category. This discrepancy reflects fundamental anatomical and physiological differences between the eye and the skin. Whereas the eye is a moist and highly exposed mucosal surface, the skin is protected by the stratum corneum—a layer of dead, keratinized cells that functions as an efficient biological barrier. For a compound to be classified as H314 (skin corrosion), it must be sufficiently aggressive to penetrate and destroy this barrier, leading to necrosis of the underlying dermal tissue. Consequently, the vast majority of drugs are clustered in the low-risk region of the distribution. The ADMETsar predictions for this endpoint are derived from the OECD Test Guideline 404 (Acute Dermal Irritation/Corrosion). Low-probability values indicate that the compound does not induce observable skin damage within up to 4 hours of contact, whereas high-probability values correspond to compounds that produce visible dermal necrosis following exposure times ranging from 3 minutes to 4 hours. |
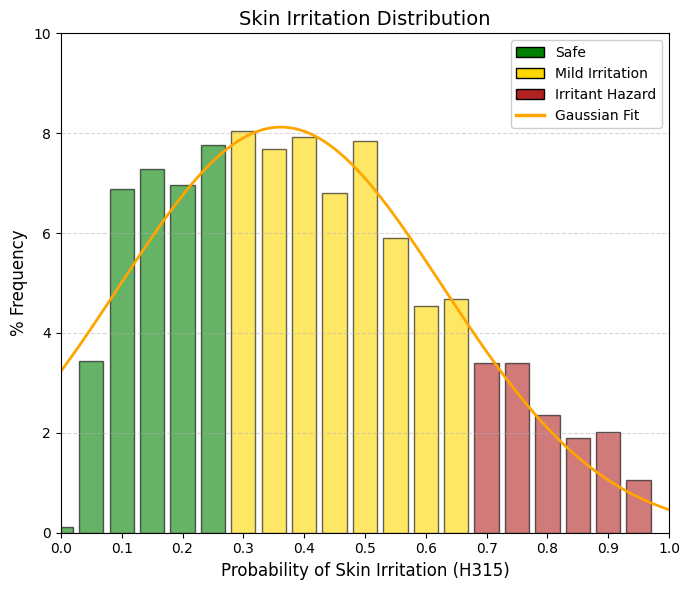
Skin irritation.
In contrast to skin corrosion, which displays a steeply declining distribution reflecting the rarity of truly corrosive compounds, skin irritation potential (H315) follows an approximately Gaussian distribution centered around 0.36. This pattern indicates that mild skin irritation—manifesting as transient redness or dryness—is a common and expected property of many pharmacologically active compounds. Most approved drugs occupy the central region of the distribution, corresponding to mild to moderate irritant potential, whereas only a small fraction of compounds are either completely non-irritating or highly aggressive. The stratum corneum generally withstands chemical insult but responds with inflammation, reflecting a temporary disruption of the skin’s lipid barrier. Such responses are not exceptional but rather typical, as the majority of drugs induce some degree of reversible perturbation of the cutaneous barrier. A key distinction emerges when comparing skin irritation with ocular irritation. In the H319 eye irritation distribution, approximately 10% of compounds occupy the extreme right bin (1.0), whereas in the H315 skin irritation distribution, the corresponding high-probability bin (0.95) accounts for only about 1% of drugs. This difference underscores the substantially greater resistance of skin to chemical irritation relative to the eye. The machine-learning model implemented in ADMETsar 3.0 accounts for this biological disparity by penalizing skin irritation less severely than ocular irritation. ADMETsar 3.0 was trained using compounds with established regulatory classifications under the United Nations’ Globally Harmonized System (GHS). Within this framework, the H315 label (“Causes skin irritation”) is assigned when a compound induces erythema (visible reddening due to inflammation) and/or edema (tissue swelling caused by fluid accumulation) in standardized assays, including OECD Test Guideline 404 or validated in vitro human skin models. Unlike skin corrosion, which involves irreversible tissue destruction, H315-classified irritation is fully reversible, with complete tissue recovery typically occurring within 14 days. |
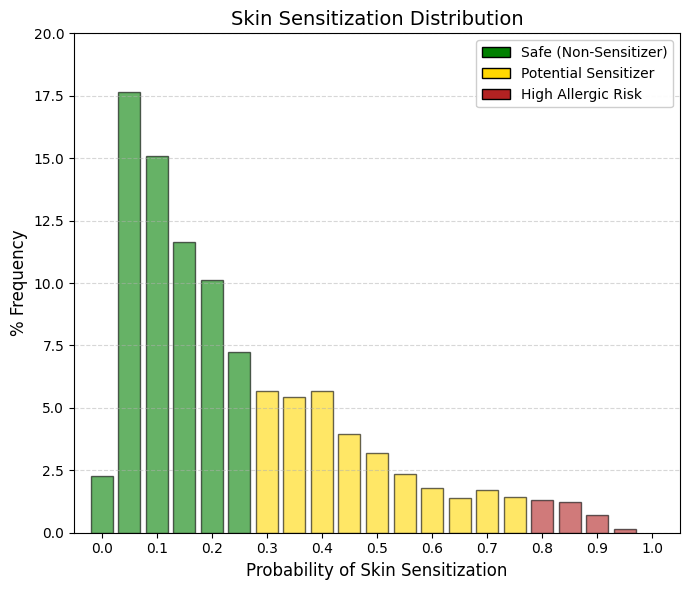
Skin sensitisation.
Sensitization is an immunological reaction, and for it to occur the drug molecule must covalently bind to proteins in the skin, forming a complex known as a hapten, which is subsequently recognized and attacked by T lymphocytes. A hapten is a small molecule that, by itself, is not capable of inducing a complete immune response. However, it can be recognized by the immune system when it covalently binds to a larger protein, known as a carrier protein. Upon binding to this protein, a hapten-protein complex is formed that can function as a complete antigen and trigger an immune response. The relationship between haptens and T lymphocytes can be understood through the process of antigen presentation. When the hapten-protein complex enters the organism, it may be captured by antigen-presenting cells such as dendritic cells, macrophages, or B lymphocytes. These cells internalize the complex and degrade the carrier protein into small peptides. These peptides are then presented on the cell surface bound to major histocompatibility complex class II (MHC II) molecules. Helper T lymphocytes (T helper, CD4⁺) recognize these peptide-MHC complexes through their T-cell receptor (TCR) and become activated. A key aspect is that T lymphocytes do not recognize the hapten directly. Instead, they recognize peptides derived from the carrier protein that are presented in the MHC molecules of the antigen-presenting cell. Therefore, T-cell activation depends on the carrier rather than on the hapten itself. This characteristic explains why haptens must be bound to proteins in order to induce an effective immune response. In contrast, B lymphocytes can directly recognize the hapten through their membrane receptor (BCR). When a B lymphocyte recognizes a hapten bound to a protein, it internalizes the entire complex. The carrier protein is then processed and fragments of this protein are presented on MHC II molecules. These peptide fragments are recognized by helper T lymphocytes that are specific for the carrier. Once activated, the T cells provide co-stimulatory signals and cytokines that stimulate the B lymphocyte to proliferate, differentiate, and produce antibodies specifically directed against the hapten. This mechanism is known as the hapten–carrier effect and represents a classic example of cooperation between T and B lymphocytes. Through this cooperation, the immune system can generate an effective response against small molecules that would otherwise not be immunogenic. This phenomenon also has clinical relevance, as certain drugs or chemical substances may act as haptens when they bind to proteins in the body, thereby triggering immune responses such as drug allergies or contact hypersensitivity reactions. Fortunately, the vast majority of approved drugs do not possess the chemical reactivity required to initiate this immunological cascade. Consequently, the main peak in the dataset (almost 55%) is concentrated in the safest region (bins 0.050.20). Unlike irritation, which represents temporary tissue damage, sensitization creates immunological memory. Once a patient or worker becomes allergic, the hypersensitivity to that molecule will generally persist for life. For this reason, the filtering criteria applied here are strict and depend on the intended use:
🟢 GREEN (< 0.3): Safe and non-allergenic. These molecules are structurally inert toward skin proteins and do not form haptens. They are therefore ideal candidates for topical formulations such as creams, gels, transdermal patches, or medical cosmetics.
🟡 YELLOW (0.3-0.8): Moderate risk. These compounds display some degree of chemical reactivity. The immune system could recognize them if exposure is repeated or if the skin barrier is compromised. They are generally acceptable for oral or injectable administration. However, if formulated for topical use, additional clinical testing would be required to ensure that the applied dose does not cross the sensitization threshold.
🔴 RED (> 0.8): Confirmed sensitizers (immunological alert). These substances have a high probability of inducing allergic contact dermatitis, a T-cell-mediated reaction. A patch or cream containing compounds in this range would likely cause severe eczema in patients after only a few exposures. Although the drug may still be suitable for oral administration, it triggers a critical occupational safety alert. Chemical operators in manufacturing plants would need to use strict personal protective equipment (e.g., Tyvek suits and double nitrile gloves), because airborne drug powder could rapidly sensitize exposed workers. |
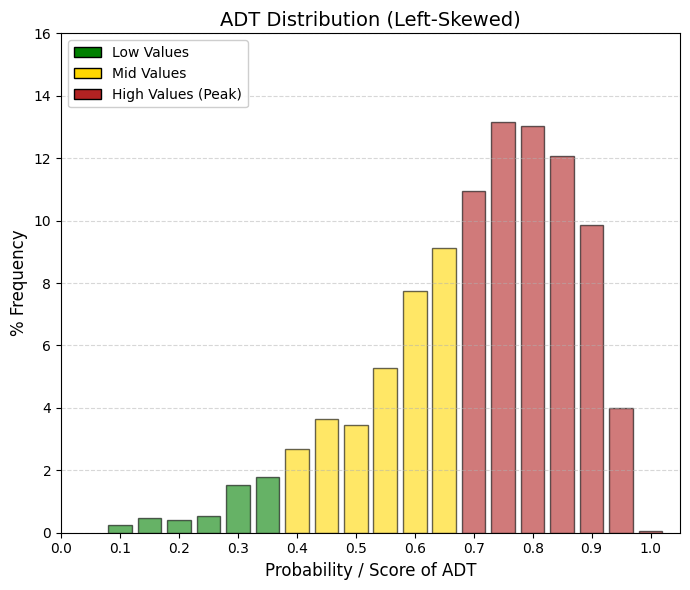
ADT: acute dermal toxicity.
This parameter is not used to determine whether a molecule is suitable as a drug, but rather to classify how it should be handled and manufactured.
🟢 GREEN (< 0.4): Biologically Mild Compounds. Even when applied in very large doses through the skin, these compounds do not produce severe systemic toxicity. They are typically large molecules with very limited skin penetration.
🟡 YELLOW (0.4-0.7): Moderate Systemic Toxicity.
🔴 RED (> 0.7): Highly Bioactive Compounds (industry standard). If such compounds cross the skin in their pure state and at high concentration, they may produce severe systemic effects. In practice, the molecule is assigned an occupational risk alert label. Chemical plant operators involved in the synthesis or handling of these substances must therefore use personal protective equipment (PPE)—including full protective suits and nitrile gloves—to prevent absorption of the pure powder through the skin.
The acute dermal toxicity test is used to evaluate the systemic toxic effects that may occur after a single cutaneous exposure to a chemical substance or drug. Its primary objective is to determine whether the compound can cause significant toxicity following skin contact and to estimate parameters such as the dermal LD₅₀, defined as the dose that causes death in 50% of the test animals. This study is conducted according to standardized protocols, mainly those established by the Organisation for Economic Co-operation and Development in OECD Test Guideline 402. In this type of assay, laboratory animals are typically used, with rats being the preferred species, although rabbits may also be employed. The animals must be young adults with relatively homogeneous body weights in order to reduce experimental variability. Prior to the start of the study, they undergo an acclimatization period of several days. Approximately twenty-four hours before compound administration, the dorsal area of the animal is shaved to expose a region corresponding to roughly 10% of the total body surface. It is essential that the skin remains intact and free of lesions in order to avoid interference with compound absorption. The drug or test substance is prepared in a suitable formulation for topical administration, which may consist of a solution, suspension, or even a moistened solid. A single dose is then applied directly to the shaved skin area. The treated region is generally covered with a porous gauze and a semi-occlusive dressing to maintain contact between the compound and the skin while preventing ingestion by the animal. The typical exposure period is approximately 24 hours. After this time, the dressing is removed and, if necessary, the application site is gently cleaned to remove residual compound. Depending on the prior knowledge available regarding the toxicity of the substance, the study may be conducted either as a limit test or as a multi-dose study. In the limit test, a single relatively high dose—usually 2000 mg/kg body weight—is applied. If neither mortality nor severe signs of toxicity are observed, the compound is considered to have low dermal toxicity. In other cases, several dose levels are administered in order to estimate the dermal LD₅₀ more precisely. Following exposure, the animals are monitored for a period of at least fourteen days. During this observation period, a variety of clinical parameters are carefully recorded, including behavioral changes, respiratory alterations, tremors, convulsions, excessive salivation, and body weight loss. Possible local skin effects are also evaluated, including erythema, edema, desquamation, or necrosis, in order to distinguish systemic toxicity from local irritant effects. At the end of the observation period—or earlier in the event of animal death—a necropsy is performed to examine potential macroscopic alterations in major organs. In some cases, additional histopathological analyses are conducted to further characterize the observed toxic effects. The results obtained allow estimation of the dermal LD₅₀ and contribute to the toxicological classification of the compound according to international regulatory systems, such as the Globally Harmonized System of Classification and Labelling of Chemicals established by the United Nations. Furthermore, these data form part of the information required to evaluate the safety of a drug or chemical substance prior to its use or commercialization. |
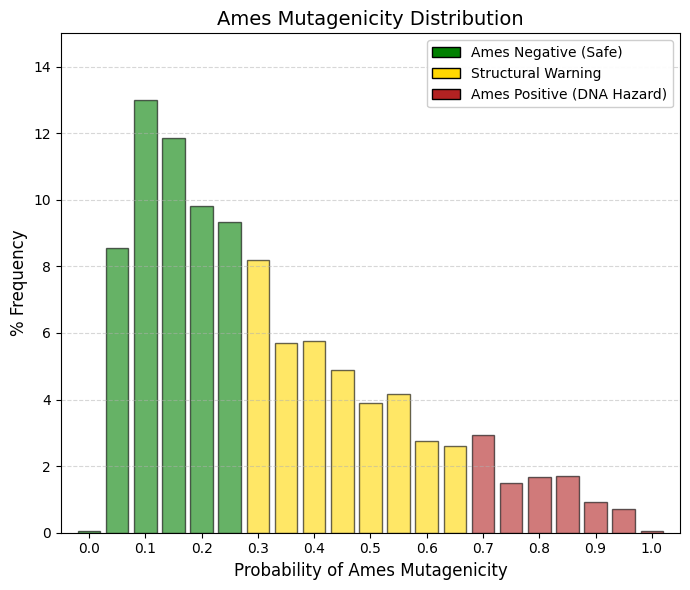
Ames test is an assay to determine the ability of a chemical or drug to induce mutations in DNA.
Among all the parameters discussed, this is probably the most stringent exclusion filter when searching for drugs intended for general use (e.g., analgesics, antidepressants, antibiotics).
🟢 GREEN (< 0.3): The molecule does not interact covalently with DNA.
🟡 YELLOW (0.3-0.7): Structural Alert Review. Artificial intelligence detects potentially problematic substructures (for example, aromatic amines, epoxides, or nitroaromatic groups). These alerts may sometimes represent false positives, but they require careful evaluation.
🔴 RED (> 0.7): Lethal Filter (Ames Positive). The molecule is highly likely to induce mutations and, in the long term, cancer. Unless the specific objective is the development of oncology drugs (e.g., chemotherapeutic agents), any candidate compound falling within this category should be discarded.
The Ames test is a microbiological assay widely used to evaluate the mutagenic potential of chemical compounds, including pharmaceuticals, pesticides, and environmental contaminants. Its purpose is to determine whether a substance can induce mutations in DNA, which constitutes an early indicator of possible carcinogenicity. The assay was developed in the 1970s by the geneticist Bruce Ames and has since become one of the standard methods for the initial screening of mutagenicity in genetic toxicology. The procedure has been internationally standardized, among others, in OECD Test Guideline 471 issued by the Organisation for Economic Co-operation and Development. The principle of the assay is based on the use of mutant strains of the bacterium Salmonella typhimurium (and in some protocols also Escherichia coli). These bacteria carry specific mutations in genes involved in the biosynthesis of histidine (or tryptophan in the case of E. coli), which prevents them from growing in culture media lacking this amino acid. Under normal conditions, therefore, these bacteria cannot proliferate on plates without histidine. However, if a reverse mutation (genetic reversion) occurs that restores the function of the mutated gene, the bacterium regains the ability to synthesize histidine and can form visible colonies on the selective medium. During the assay, the mutant bacteria are exposed to the chemical compound under investigation. This exposure may be performed either directly or in the presence of a metabolic activation system known as the S9 fraction, which is a liver extract obtained from rodents previously treated with enzyme-inducing agents. The S9 fraction is used because many compounds are not intrinsically mutagenic but may become reactive metabolites after biotransformation by hepatic metabolic enzymes, thereby partially simulating the metabolism that would occur in higher organisms. After mixing the bacteria with the test compound (with or without the S9 fraction), the suspension is spread onto agar plates containing a minimal amount of histidine. This small quantity allows the bacteria to undergo a few initial cell divisions, which is necessary for mutations to become phenotypically expressed. The plates are then incubated for approximately 48 hours. If the compound induces mutations, an increased number of bacterial colonies capable of growing on histidine-deficient medium will appear, as some cells will have undergone reverse mutations that restore the biosynthetic pathway. The outcome of the assay is evaluated by comparing the number of revertant colonies observed on plates treated with the compound with those observed on negative control plates (without a mutagenic substance). If the number of revertants increases significantly and in a dose-dependent manner, the compound is considered potentially mutagenic in this system. Typically, several different bacterial strains are used, each designed to detect distinct types of mutations, such as base-pair substitutions or frameshift mutations. The Ames test is widely employed in the safety evaluation of new molecules during pharmaceutical and chemical development due to its rapidity, low cost, and high sensitivity. However, because it is based on a bacterial system, its results must be interpreted in conjunction with other genotoxicity assays performed in eukaryotic cells or animal models. These complementary studies help determine whether the mutagenic effects observed in bacteria may also occur in more complex organisms. Overall, the Ames test constitutes a fundamental tool in the early screening of potentially genotoxic substances. |
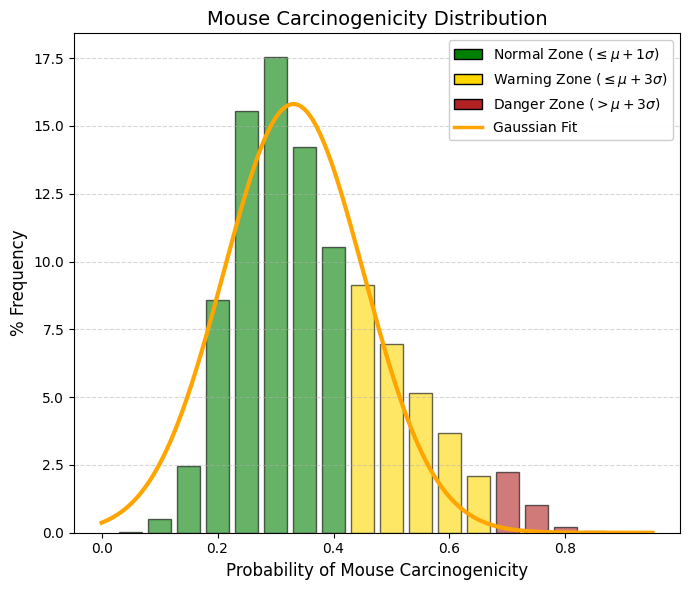
Mouse_carcinogenicity_c
This parameter estimates the probability that a drug will induce tumors in a mouse in vivo model following chronic exposure, typically assessed using the standardized two-year carcinogenicity assay. It is important to recognize that not all carcinogens are mutagenic. The Ames parameter described previously detects genotoxic carcinogens, which directly damage DNA. Such compounds are relatively rare among marketed drugs, except in the case of certain oncology therapeutics. In contrast, non-genotoxic carcinogens do not directly interact with DNA but may promote tumor formation over the long term through alternative mechanisms, such as sustained oxidative stress, endocrine disruption, or chronic inflammation. Mice are highly sensitive biological models. Many drugs that are safe in humans cause the mouse liver or thyroid to operate at maximal metabolic capacity in an attempt to eliminate the compound. This chronic metabolic stress may induce hyperplasia (abnormal cellular proliferation), which is interpreted as an early signal of carcinogenicity and typically results in residual scores in the range of approximately 0.2-0.4. Rodent carcinogenicity findings are a common source of regulatory delays during drug development. For a screening database containing approximately four million compounds, the filtering criteria should therefore be applied as follows:
🟢 GREEN (< 0.4): Safe drugs. These compounds do not induce tumors even after chronic exposure at high doses. They are ideal candidates for medications intended for lifelong administration, such as statins, antihypertensives, or antidiabetic drugs.
🟡 YELLOW (0.4-0.7): Rodent-specific toxicity risk. These compounds may represent potential non-genotoxic carcinogens. In many cases, the mechanism responsible for tumor formation in mice is not relevant to humans—for example, the induction of hepatic enzymes that are specific to rodents. Additional mechanistic and toxicological studies will typically be required to demonstrate to regulatory authorities that the observed effect is species-specific. Such compounds may still be acceptable for short-duration treatments (e.g., a seven-day antibiotic regimen).
🔴 RED (> 0.7): Oncological red alert. These compounds show a high probability of inducing generalized malignant tumors. They are generally rejected unless they are specifically designed as anticancer drugs, where the therapeutic benefit of treating life-threatening cancer may outweigh the long-term risk of secondary tumor formation. |
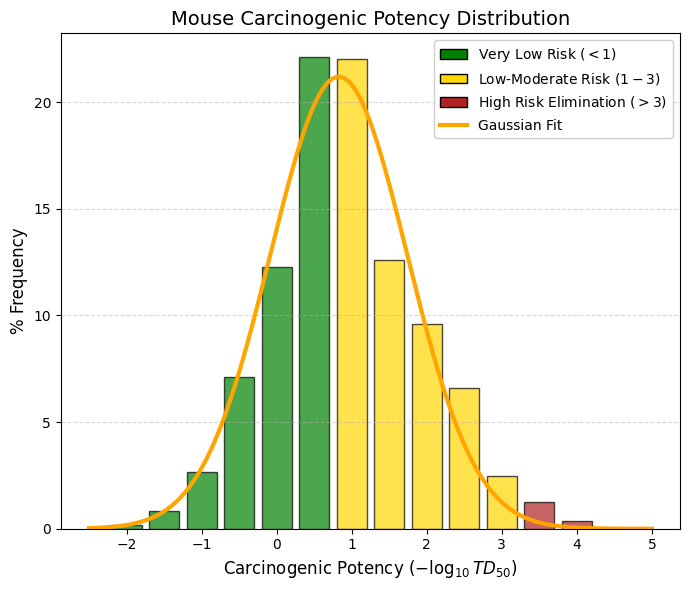
Mouse_carcinogenicity
The Mouse_carcinogenicity parameter from admetSAR 3.0 is a quantitative model that estimates carcinogenic potency in mice using the experimental basis of TD50, which represents the chronic dose required to induce tumors in 50% of animals in long-term exposure studies, typically lasting two years. This endpoint is reported as the transformed value -log10(TD50 [mg/kg/day]), meaning that the scale is inversely related to actual toxicity: when TD50 decreases (i.e., a lower dose is required to induce tumors), the numerical value of the descriptor increases, indicating greater carcinogenic potency. In practical terms, the prediction range observed in training datasets and in typical model outputs is generally between approximately 0 and 6 in units of -log(mg/kg/day), although there is no strict mathematical upper limit. Values close to zero usually correspond to compounds with low carcinogenic potency or very high TD50 values, whereas higher values indicate greater toxicological risk. As a general reference, values below 1 are typically interpreted as very low carcinogenicity, values between 1 and 3 as low to moderate, between 3 and 5 as moderate to high, and values above 5 as high carcinogenic potency. From the perspective of medicinal chemistry and ADMET evaluation during early-stage drug discovery, this descriptor is used primarily as a comparative ranking tool rather than as an absolute predictor of human risk. For this reason, it is usually analyzed together with other toxicological endpoints and with the classification models associated with the same system, which predict binary carcinogenicity probability instead of continuous potency. This approach allows researchers to prioritize molecules with better safety profiles during virtual screening campaigns or lead optimization processes.
🟢 GREEN (< 1): Very low carcinogenic potency. These are considered the safest compounds.
🟡 YELLOW (1-3): Caution. These compounds may be retained in virtual screening but will require further risk-benefit analysis in later stages (acceptable for short-term drugs, questionable for chronic treatments).
🔴 RED (> 3): Direct exclusion from virtual screening (unless the goal is to design chemotherapeutic agents), since these compounds may induce tumors at dangerously low doses. |
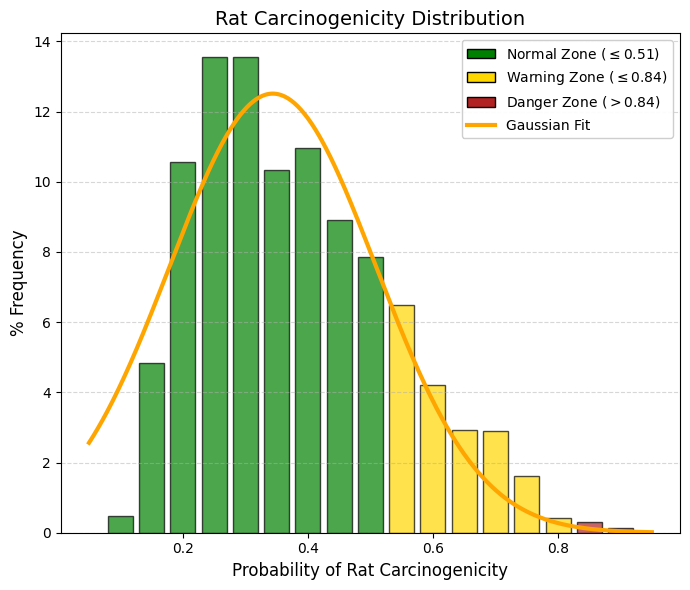
Rat carcinogenicity (c).
|
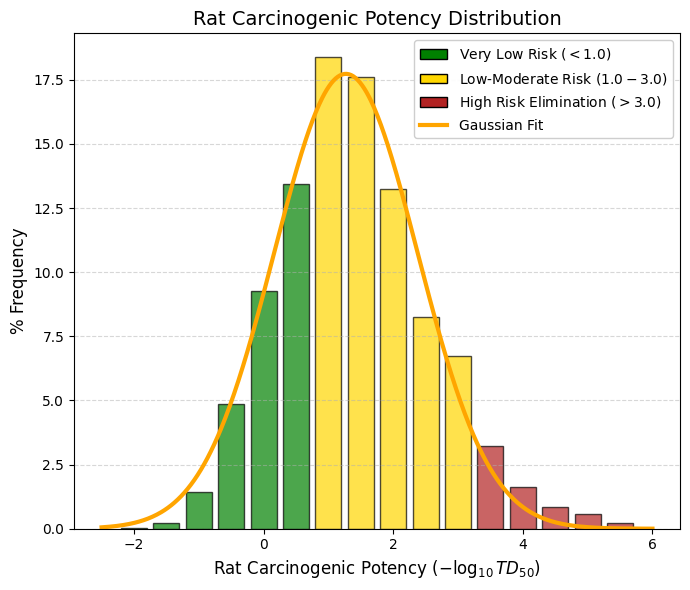
Rat carcinogenicity: Unit: -log mg/kg.
|
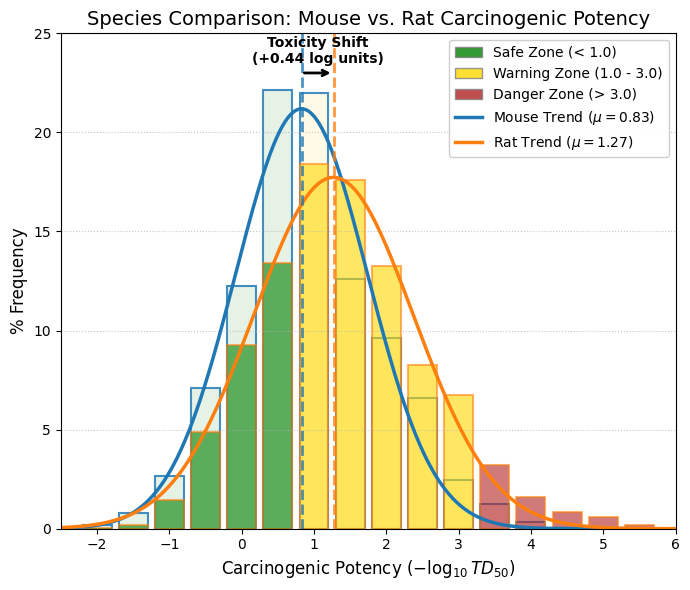
|
In mice, the mean value is 0.82, which indicates that the “average” drug lies comfortably within the very low carcinogenic potency range. In contrast, in rats the mean shifts to 1.27. Statistically, this suggests that rats are more sensitive to long-term chronic toxicity than mice for the set of drugs recorded in DrugBank. The Rat_carcinogenicity endpoint in admetSAR 3.0 is a quantitative model designed to estimate carcinogenic potency in rats based on experimental data from chronic carcinogenicity studies. The model uses TD50 as its core variable, representing the chronic daily dose capable of inducing tumors in 50% of exposed animals during long-term studies, typically lasting around two years. The output is expressed as -log10 (TD50 [mg/kg/day]), meaning that the numerical value is inversely related to the dose required to produce the carcinogenic effect. |
Due to this logarithmic transformation, higher descriptor values correspond to greater carcinogenic potency, since they reflect lower TD50 values (i.e., smaller doses are sufficient to induce tumors). Conversely, lower values indicate weaker carcinogenic potency associated with higher TD50 values. In practice, the values predicted by this model generally fall within an approximate range of 0-6 units of -log(mg/kg/day), although the model does not impose strict mathematical limits because the effective range depends on the distribution of values present in the experimental dataset used for training.
In addition to the continuous regression model Rat_carcinogenicity, the system also includes the endpoint Rat_carcinogenicity_c, which corresponds to a classification model. In this case, the algorithm does not predict a continuous carcinogenic potency value but instead assigns the molecule to a qualitative category—typically carcinogenic or non-carcinogenic—based on structural patterns and available experimental data. |
This type of model is particularly useful for initial screening of large chemical libraries, whereas the continuous TD50-based model allows a more quantitative comparison of relative carcinogenic potency among compounds.
Within the context of ADMET evaluation during drug discovery, both endpoints are used in a complementary manner. The classification model enables rapid identification of potentially problematic compounds, while the continuous -log(TD50) model facilitates relative prioritization of molecules according to their estimated carcinogenic potency in rats. Nevertheless, these predictions should be interpreted as indicators of relative toxicological risk, and they are typically considered alongside other toxicological and pharmacokinetic parameters in order to obtain a more comprehensive assessment of the safety profile of a candidate compound. |
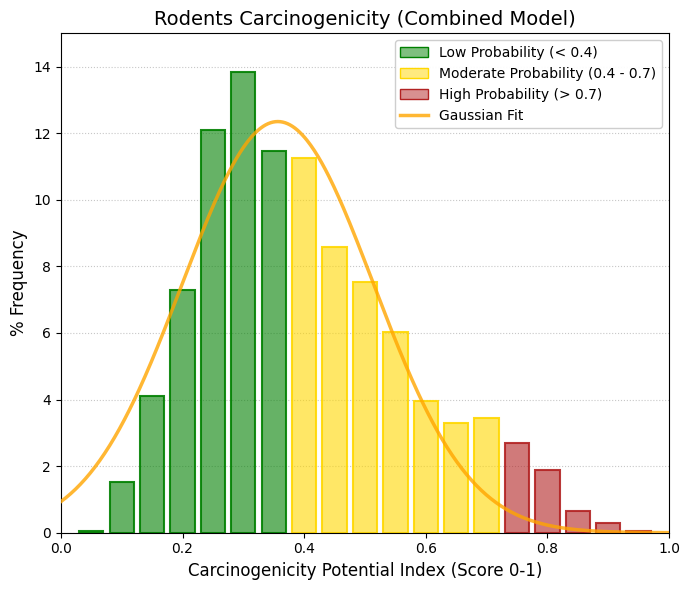
Rodents carcinogenicity: Unit: -log mg/kg.
In rodent carcinogenicity studies, the value -log(mg/kg) typically refers to a logarithmic transformation of a compound’s carcinogenic potency, most commonly derived from the TD50, defined as the chronic dose rate (mg/kg body weight/day) required to induce tumors in 50% of test animals by the end of a standard lifespan. Using a negative logarithmic scale allows toxicologists to represent a very wide range of carcinogenic potencies on a manageable linear scale, conceptually similar to the pD scale used in pharmacology. On this scale, a higher -log(mg/kg) value corresponds to a more potent carcinogen, because it represents a smaller TD50—that is, a lower dose is sufficient to induce tumors.
The TD50 index is the standard numerical metric used to compare carcinogenic potency across different chemicals and experimental species. Because carcinogenic potency can vary enormously between compounds, logarithmic scaling is essential. In practice, rodent carcinogenic potencies span more than seven orders of magnitude, and chemicals known to be carcinogenic in humans often appear at the higher end of the -log(mg/kg) scale. In carcinogenicity bioassays, researchers also consider dose limits to avoid misleading outcomes caused by unrealistically high exposures. Regulatory guidelines such as ICH S1C(R2) typically cap the high dose at approximately 1,500 mg/kg/day for compounds that do not produce overt toxicity. Many toxicologists argue that testing above 1,000 mg/kg/day (or approximately 1% of the diet) is unnecessary, because most human carcinogens can be detected at substantially lower doses. When extrapolating rodent data to humans, safety factors—commonly around 10— are often applied to account for interspecies variability and uncertainty. Despite physiological differences between species, there is generally a strong correlation between carcinogenic potency in rats and mice. When potency is expressed in mg/kg/day, the interspecies potency ratio tends to follow a lognormal distribution centered approximately around 1, indicating that mg/kg is a reasonably robust unit for comparing exposure and carcinogenic risk across rodent species.
Within admetSAR 3.0, the predicted values for rodent carcinogenicity are normalized to a range between 0 and 1. This transformation rescales the original potency estimates to facilitate comparison and ranking within large compound libraries. Consequently, the reported values should be interpreted primarily as relative indicators of carcinogenic risk, rather than as direct quantitative equivalents of experimental TD50 measurements. |
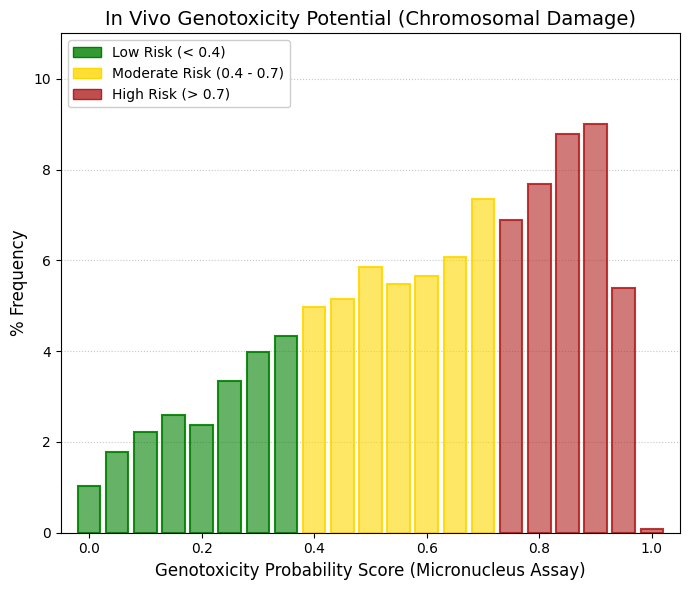
Micronucleus.
Genotoxicity testing of new chemical entities is an integral component of the drug development process and constitutes a regulatory requirement prior to the approval of new medicines. Genotoxicity refers to the study of adverse effects of chemical substances on genetic material. A variety of experimental methods are routinely used to evaluate the genotoxic potential of compounds, including the comet assay, chromosomal aberration assay, bacterial reverse mutation test (Ames test), and the micronucleus assay, among others. Among these methods, the in vivo micronucleus assay is one of the most commonly used tests for detecting chromosomal damage. This assay identifies compounds capable of disrupting the mitotic process, leading to the formation of micronuclei—small extranuclear bodies containing chromosomal fragments or whole chromosomes that were not properly incorporated into the daughter nuclei during cell division. As such, the micronucleus test is particularly useful for detecting clastogenic agents (which cause chromosomal breaks) and aneugenic agents (which interfere with chromosome segregation). Although the predictive model indicates a high clastogenic/aneugenic risk for a large proportion of the library, the fact that these compounds correspond to approved drugs suggests that current in silico micronucleus models exhibit a relatively high rate of false positives. This is largely attributable to the overrepresentation of structural alerts in the absence of pharmacokinetic and dosing context. Consequently, this parameter should be interpreted with caution and used primarily as a secondary prioritization filter, rather than as an absolute exclusion criterion during compound selection. |
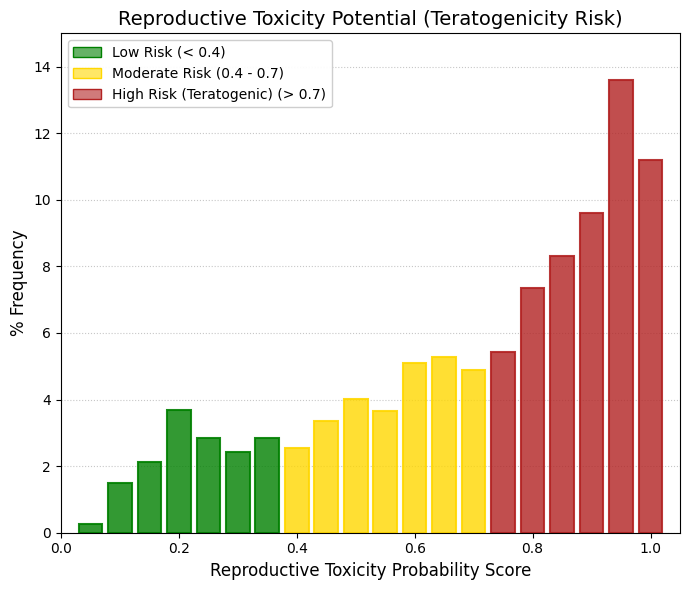
Reproductive toxicity.
While the drugs contained in DrugBank have generally been shown to be chronically safe in adult organisms—as reflected by their low carcinogenicity in rodent models—they exhibit a relatively high rate of predicted reproductive toxicity and genotoxicity. This observation is consistent with the classical safety profile of many marketed drugs: they are effective and safe for a fully developed adult organism, yet their cellular interactions may become hazardous when genetic material is insufficiently protected or when they interfere with the rapid cellular differentiation processes characteristic of embryonic development. The fact that nearly 60-70% of approved drugs show a high probability of reproductive toxicity is fully consistent with clinical and regulatory experience. Historically, particularly following the thalidomide tragedy in the 1960s, it became evident that developing embryos are extremely sensitive to xenobiotics. Most drugs are small molecules specifically designed to cross biological membranes, which means they can also cross the placental barrier relatively easily and reach the developing fetus. Within the FDA Pregnancy Risk Classification system (Categories A, B, C, D, and X), only a very small number of drugs fall into Category A, indicating well-controlled studies demonstrating safety in humans. The vast majority are classified as Category C (risk cannot be ruled out; teratogenic effects observed in animals), Category D (evidence of fetal risk), or Category X (contraindicated during pregnancy). In this context, the in silico predictions generated by admetSAR 3.0 are consistent with biological expectations: by default, a bioactive compound has a substantial probability of interfering with embryonic signaling pathways.
Reproductive toxicity represents one of the most critical safety concerns in pharmaceutical development and is a frequent reason for the withdrawal of drugs from the market. This form of toxicity encompasses the adverse effects that a chemical substance may exert on fertility, embryonic and fetal development, and the reproductive function of subsequent generations. Because of its potential impact on offspring, the evaluation of reproductive toxicity constitutes a fundamental component of preclinical and regulatory toxicological studies. Adverse outcomes associated with reproductive toxicity may manifest in several forms during prenatal development. Among the most significant are teratogenic effects, which involve congenital malformations in the fetus, as well as intrauterine growth restriction and other developmental abnormalities that may result in low birth weight or impaired postnatal growth. These effects can have long-term consequences for individual health, affecting both neonatal survival and later physiological development. In addition to direct fetal effects, reproductive toxicity may also significantly affect the sexual function and reproductive capacity of the offspring. Exposure to certain compounds during critical developmental windows can disrupt the maturation of the reproductive system, alter hormonal regulation, or impair gametogenesis, ultimately leading to fertility problems or altered reproductive behavior in adulthood. At the molecular level, several mechanisms may underlie drug-induced reproductive toxicity. These include interference with cellular signaling pathways, alterations in gene expression during key stages of embryonic development, and the induction of oxidative stress, which can damage essential cellular structures and biomolecules. Such processes may disrupt cellular proliferation, differentiation, and survival within embryonic or reproductive tissues, ultimately leading to the adverse outcomes observed in toxicological studies. |
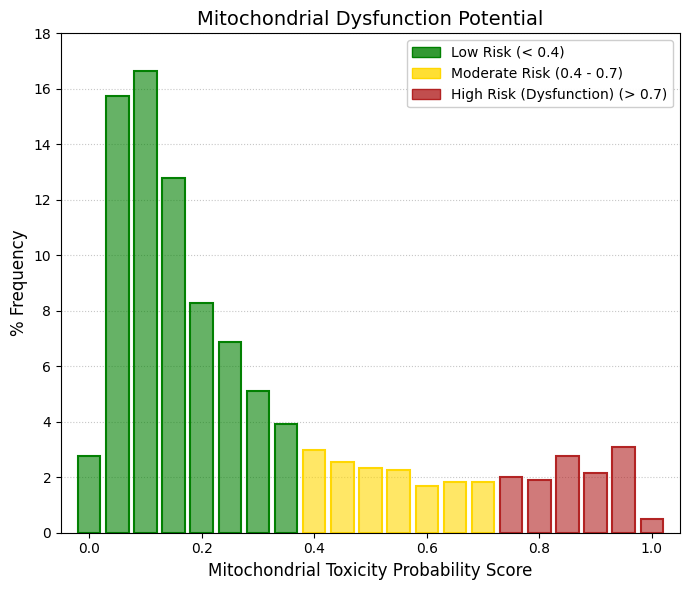
Mitochondrial toxicity.
Mitochondria are essential organelles in human cells, responsible for generating more than 95% of cellular energy through oxidative phosphorylation. However, several drugs and environmental chemicals may induce mitochondrial dysfunction, which can contribute to the development of complex diseases. Compounds may impair mitochondrial function through multiple mechanisms, including direct damage to mitochondrial DNA (mtDNA), inhibition of oxidative phosphorylation, increased oxidative stress, or reduction of the mitochondrial inner membrane potential. In the analyzed dataset, the distribution of predicted mitochondrial toxicity shows a strong concentration in the lowest risk regions, with values around 0.05, 0.10, and 0.15 accounting for nearly 45% of all drugs. As the values approach the high-risk zone (>0.7), the frequencies decrease sharply, representing only approximately 1-3% of the compounds. This distribution is fully consistent with both toxicological and clinical expectations. Mitochondria represent the fundamental energy-generating system of the cell, and severe impairment of mitochondrial function would rapidly lead to systemic toxicity, including conditions such as lactic acidosis, acute liver failure, and severe myopathies. As a consequence, compounds that directly disrupt mitochondrial function are typically eliminated early during preclinical safety evaluation and rarely progress to clinical development. Therefore, it is not surprising that drugs ultimately approved by regulatory authorities tend to exhibit a favorable mitochondrial safety profile, reflected by the strong enrichment of compounds with low predicted mitochondrial toxicity in the dataset. |
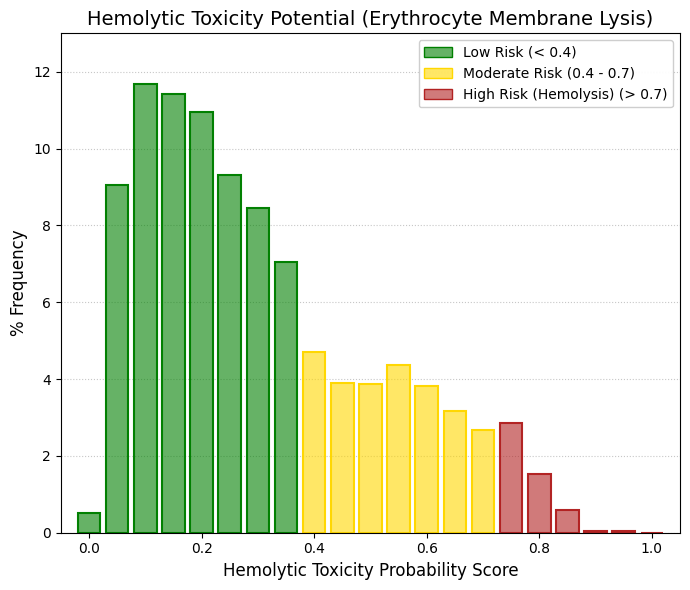
Hemolytic toxicity.
Hemolytic toxicity refers to the capacity of certain compounds to induce lysis of erythrocyte membranes, leading to the release of hemoglobin into the plasma. This process can trigger a variety of adverse physiological effects and therefore represents an important endpoint in toxicity prediction. Compounds with hemolytic potential may act either directly or indirectly on red blood cells, altering several key properties of erythrocytes, including osmotic fragility, membrane oxidation, cell morphology, and ATP-dependent energy metabolism. These alterations can destabilize the erythrocyte membrane, ultimately causing cell rupture and the release of hemoglobin and intracellular components into the bloodstream, which may produce multiple clinical signs and systemic complications. In admetSAR 3.0, Hemolytic Toxicity is a predictive endpoint designed to evaluate whether a query molecule has the potential to induce hemolysis. The model produces a continuous score between 0 and 1, where higher values indicate a greater predicted likelihood that the compound may cause erythrocyte membrane disruption. This parameter belongs to the broader category of Human Health Toxicity endpoints and plays an important role in the early safety assessment of drug candidates, pesticides, and cosmetic ingredients. From a drug development perspective, predicting hemolytic toxicity is particularly relevant because excessive hemolysis can lead to hemolytic anemia, hemoglobinuria, jaundice, and renal complications. Consequently, compounds predicted to exhibit high hemolytic potential are typically subjected to additional experimental validation, such as in vitro erythrocyte hemolysis assays, to confirm their safety profile. For this reason, the hemolytic toxicity endpoint serves as a valuable screening and prioritization tool during early-stage ADMET evaluation. |
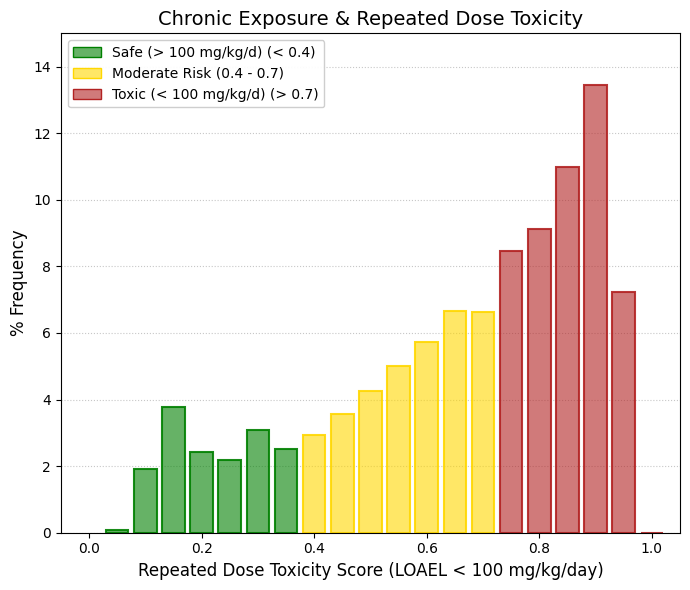
Repeated dose toxicity.
Most compounds accumulate in the red zone, with maximum peaks around 0.85 and 0.90. In other words, the model predicts that the vast majority of these drugs present repeated-dose toxicity, meaning that their LOAEL (Lowest Observed Adverse Effect Level) is predicted to be below 100 mg/kg/day. The 100 mg/kg/day threshold is extremely high. This cutoff originates from the Globally Harmonized System (GHS) for classification of chemicals and was primarily designed for industrial and environmental chemicals rather than pharmaceutical agents. For a human weighing 70 kg, a dose of 100 mg/kg would correspond to approximately 7,000 mg (7 grams) of drug per day, which is far above the typical therapeutic range of most medications. This observation is closely related to the pharmacological potency of drugs. Pharmaceutical compounds are intentionally designed to be highly potent molecules capable of modifying physiological processes at relatively low doses. Consequently, administering several grams of a drug daily to an experimental animal for extended periods—as occurs in repeated-dose toxicity studies—will almost inevitably produce detectable adverse effects, whether through hepatic metabolic stress, body weight changes, or biochemical alterations. It is also important to clarify the meaning of LOAEL. The LOAEL does not indicate lethal toxicity; rather, it represents the lowest dose at which any adverse effect is observed in experimental studies. Because drugs are pharmacologically active molecules, their LOAEL values are typically well below 100 mg/kg/day, which explains why the predictive model frequently classifies them as positive for repeated-dose toxicity according to the GHS criterion. The repeated-dose toxicity model therefore predicts a high probability of adverse effects (LOAEL < 100 mg/kg/day) for most compounds in the database, with an empirical mean of approximately 0.66. This result should not be interpreted as evidence of poor drug safety. Instead, it reflects the intrinsic pharmacological potency of therapeutically designed molecules. Bioactive compounds intended for clinical use are expected to alter physiological pathways at relatively low doses; therefore, chronic administration at doses exceeding their therapeutic range will systematically surpass the strict GHS threshold established for general-purpose chemicals. |
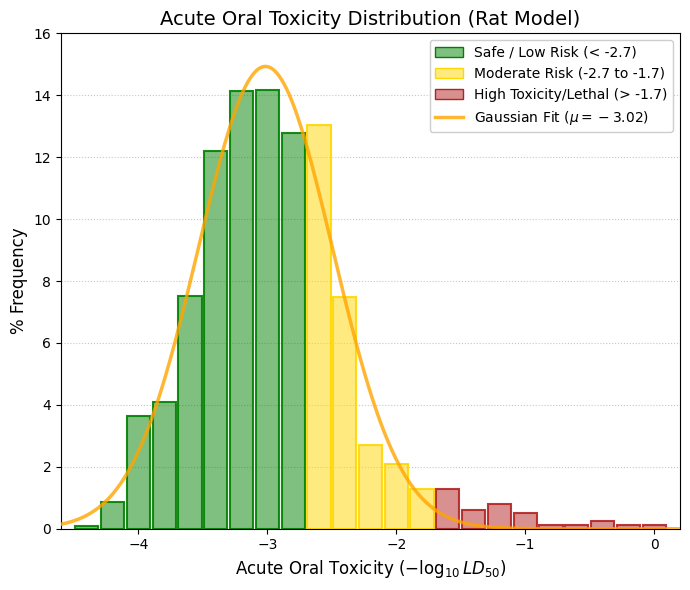
Acute oral toxicity: Unit: -log mg/kg
Acute oral toxicity (LD₅₀) represents, in practical terms, the first survival test for a chemical compound. In this descriptor, the value corresponds to the negative logarithm of the LD₅₀ dose. Consequently, the more negative the value, the higher the dose required to cause death in 50% of the test animals, and therefore the lower the intrinsic acute toxicity of the compound. For example, a value of -4.0 corresponds to an LD₅₀ of approximately 10,000 mg/kg, indicating an extremely low acute toxicity level, where unrealistically large doses would be required to cause lethality. A value of -3.0 corresponds to an LD₅₀ of around 1,000 mg/kg, which is generally interpreted as low acute toxicity and compatible with clinical safety margins. In contrast, a value of -1.0 corresponds to an LD₅₀ of approximately 10 mg/kg, indicating high acute toxicity typical of potent poisons. Using the standard toxicity classifications defined by the U.S. Environmental Protection Agency (EPA) or the Globally Harmonized System (GHS), it is possible to define a practical interpretation framework:
🟢 GREEN (Low risk / minimal concern): < -2.7: LD₅₀ > 500 mg/kg
🟡 GOLD (Moderate risk): -2.7 to -1.7, LD₅₀ between 50 and 500 mg/kg
🔴 RED (High toxicity / potentially lethal) | > -1.7: LD₅₀ < 50 mg/kg
The dataset analyzed shows a mean value of -3.015, corresponding to an LD₅₀ of approximately 1,035 mg/kg. This result indicates that the distribution is strongly centered within the high-safety region, with most compounds requiring relatively large doses to produce acute lethal effects. Overall, the acute oral toxicity (LD₅₀) profile demonstrates that the compounds in the library are overwhelmingly safe under single-exposure conditions, with an average -log₁₀(LD₅₀) value of approximately -3.01, corresponding to a safety margin greater than 1,000 mg/kg. This finding supports the interpretation that the previously observed alerts related to chronic repeated-dose toxicity do not arise from intrinsic acute chemical lethality, but rather from cumulative pharmacodynamic stress associated with the prolonged administration of highly bioactive compounds. |
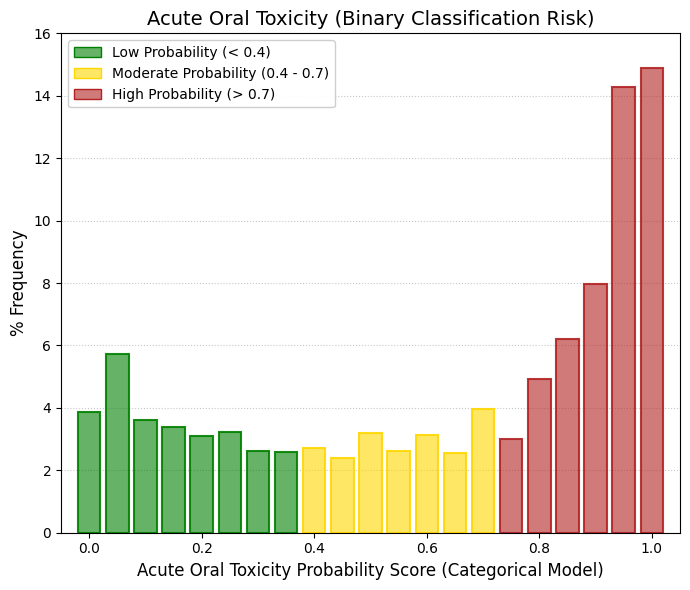
Acute oral toxicity (c).
For the continuous Acute Oral Toxicity parameter, the mean value for the approved drugs in DrugBank was -3.02 (equivalent to an LD50 of approximately 1000 mg/kg). According to the actual dose scale, this placed the vast majority of these compounds in a "Low Toxicity" or "Moderate Toxicity" zone. However, in the new model—Acute Oral Toxicity (c), where "c" stands for Categorical—the data cluster heavily in the Red Zone. Nearly 30% of the compounds fall within the 0.95 to 1.0 range, indicating a maximum probability of being classified as toxic. Why does this discrepancy occur when evaluating the exact same molecules? The explanation lies in the "Classification Threshold" used to train the categorical algorithm. Many binary acute toxicity models employ a highly conservative cutoff; for instance, in accordance with strict European regulations, they classify any compound with an LD50 < 5000 mg/kg or < 2000 mg/kg as "Toxic." Given that the DrugBank mean is roughly 1000 mg/kg, the continuous model essentially indicates an absence of lethal toxicity at low doses, whereas the categorical model signals that the regulatory threshold for the risk category has been surpassed. Ultimately, the categorical assessment predicts a high probability of toxic classification based on binary regulatory standards (mean of 0.66). Nevertheless, the complementary continuous analysis demonstrates that the intrinsic lethal magnitude (LD50) remains within moderate ranges (>1000 mg/kg). This highlights the categorical model's sensitivity to mild structural alerts and reaffirms the clinical safety of these compounds at low therapeutic doses, despite their penalization under rigid toxicological classification schemes. |
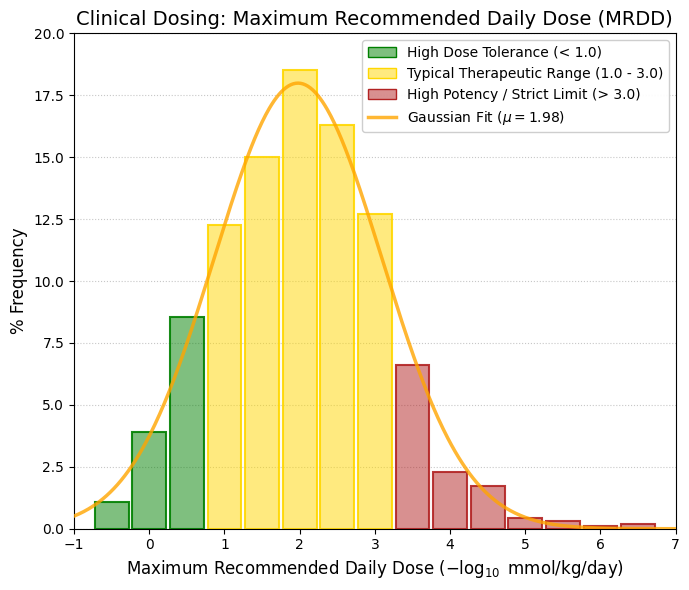
FDAMDD, -log mmol/kg-bw/day.
The Maximum Recommended Daily Dose (MRDD) provides an estimate of a chemical's toxic dose threshold in humans. MRDD (or maximum recommended therapeutic dose) values are determined from clinical trials of drugs using the oral route and daily treatment, typically lasting 3 to 12 months. These drugs are administered in single-dose or split-dose regimens to achieve the desired pharmacologic effect. Analysis of the estimated human toxic dose threshold (FDAMDD) reveals an ideal Gaussian distribution centered at 1.98 logarithmic units. This demonstrates that the molecules within the evaluated library exhibit a therapeutic potency and dosing margin characteristic of the vast majority of approved clinical drugs. In other words, they neither require massive doses (which would cause nonspecific metabolic stress) nor operate at ultra-low doses (where the slightest dosing error could prove lethal). Consequently, this validates the posological viability of the database for future pharmacological screening processes. Furthermore, the negative values observed at the left tail of the distribution (e.g., < 0) correspond to compounds with an exceptionally high maximum recommended dose threshold (> 1 mmol/kg/day). This is indicative of molecules possessing a robust systemic safety profile and negligible toxicity at standard clinical dose levels. |
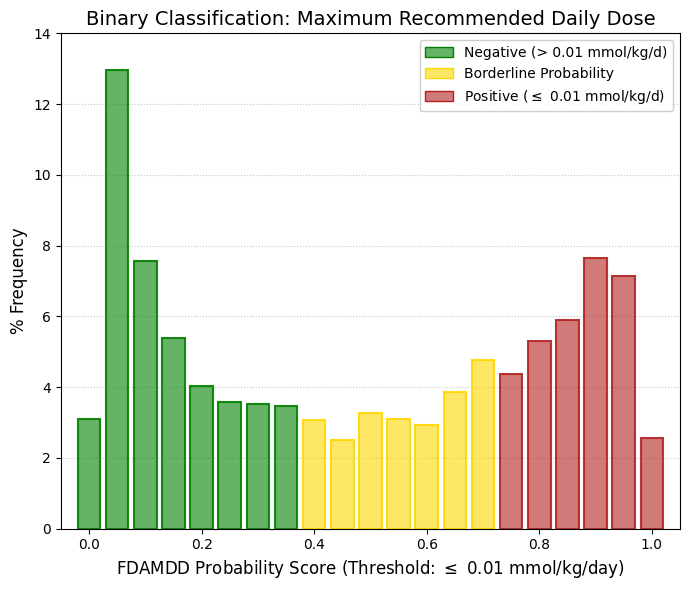
FDAMDD (c).
The data from this categorical model exhibit a bimodal, or "U-shaped," distribution: a substantial cluster of molecules accumulates on the left (low probability, designated as "Negative"), while another major cluster accumulates on the right (high probability, designated as "Positive"). The central region presents significantly lower frequencies. Effectively, the binary classification model drives half of the evaluated drugs toward the "safe/high dose" zone and the remaining half toward the "caution/low dose" zone. The analysis of the Maximum Recommended Daily Dose (FDAMDD) utilizing both continuous and categorical approaches demonstrated high algorithmic coherence. While the continuous model established the population mean at 1.978 (equivalent to ~0.0105 mmol/kg/day), the categorical model—employing a strict threshold of 0.01 mmol/kg/day—generated the anticipated bimodal distribution. This bifurcation evenly divides the library between molecules of standard pharmacological potency (where higher doses are tolerated) and high-potency compounds that require posological restriction. This congruence validates the robustness of the admetSAR 3.0 tool in consistently characterizing clinical dosing profiles across different mathematical approaches. |
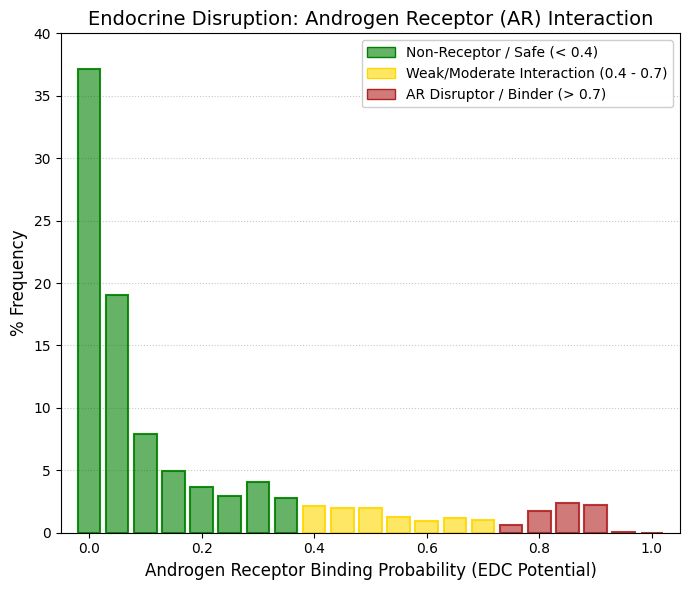
Androgen Receptor (AR) interaction.
Nearly 40% of the compounds exhibit a predicted probability of exactly 0 for interaction with the androgen receptor (AR). If the cumulative frequencies are considered up to a probability value of 0.2, it becomes evident that almost 75% of the drugs in DrugBank are predicted to be essentially free from the risk of androgen receptor-mediated endocrine disruption. A very small increase appears in the 0.85–0.90 probability range, representing only about 4% of the total compounds. These cases most likely correspond to the relatively small number of drugs in the database that are intentionally designed as hormonal ligands, such as androgenic or antiandrogenic agents used in prostate cancer therapy, or certain steroidal compounds. This observation is highly relevant for drug development. A compound that inadvertently interacts with the androgen receptor could cause substantial metabolic, reproductive, and developmental disturbances. The fact that the model predominantly classifies these molecules as non-ligands of the AR is therefore consistent with the expectation that approved drugs typically exhibit high target selectivity and limited structural promiscuity toward nuclear hormone receptors. Overall, the in silico evaluation of endocrine disruption indicates an excellent safety profile for the drugs included in DrugBank. The analysis of AR interaction displays a strongly left-skewed distribution toward negligible binding probability, with a population mean of approximately 0.16 and nearly three-quarters of the compounds robustly categorized as non-ligands. This lack of promiscuity toward nuclear hormone receptors substantially reduces the risk of reproductive toxicity, developmental disturbances, and metabolic endocrine disruption, all of which are critical considerations during the preclinical safety profiling of therapeutic agents. |
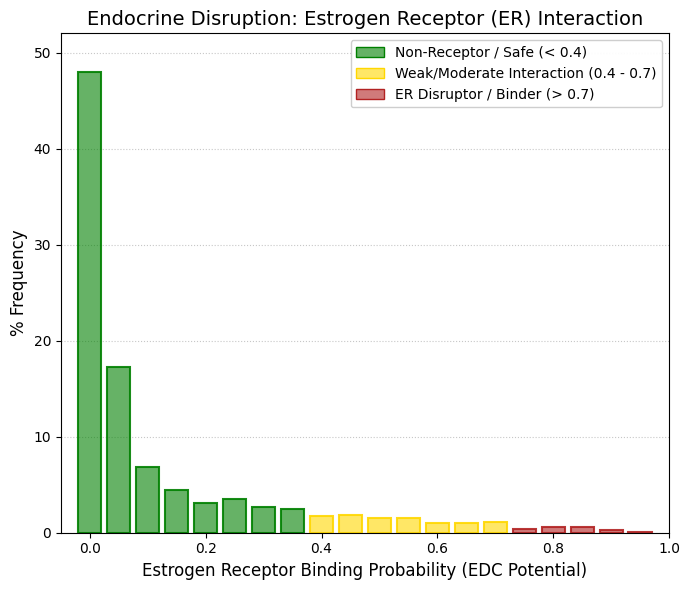
Estrogen Receptor (ER).
Approximately 48% of the pharmaceutical compounds catalogued in DrugBank exhibit a strictly zero predicted probability of binding to the estrogen receptor (ER). When the distribution is extended to include compounds with probabilities up to 0.1, more than 70% of the drugs fall within this lowest interval, indicating the absence of any measurable estrogenic affinity. This pronounced skew toward very low interaction probabilities suggests that, for the majority of approved or investigational drugs, unintended engagement with estrogen receptor signaling pathways is highly unlikely. The estrogen receptor (ER) is a nuclear hormone receptor that plays a central role in the regulation of reproductive development and physiology. Beyond its classical functions in reproductive tissues, ER signaling also contributes significantly to systemic metabolic homeostasis, influencing processes such as lipid metabolism, glucose regulation, and energy balance. Importantly, dysregulation of ER-mediated signaling is strongly implicated in the pathogenesis of several hormone-dependent malignancies, most notably breast cancer, where estrogen-driven transcriptional programs can promote cellular proliferation, survival, and tumor progression. The broader evaluation of potential interactions with nuclear hormone receptors further supports the limited endocrine-disrupting liability of most DrugBank compounds. Computational predictions indicate that the vast majority of molecules lack measurable affinity for both the androgen receptor (AR) and the estrogen receptor (ER), with mean predicted interaction probabilities of 0.16 and 0.11, respectively. In the specific case of ER, nearly half of the molecules analyzed displayed a strict probability of zero for inducing estrogenic interference. This marked absence of structural promiscuity toward steroid hormone receptors suggests that the residual risk associated with endocrine disruption,particularly with respect to reproductive toxicity, developmental perturbations, or hormone-dependent proliferative effects, is likely negligible for most compounds within the dataset. |
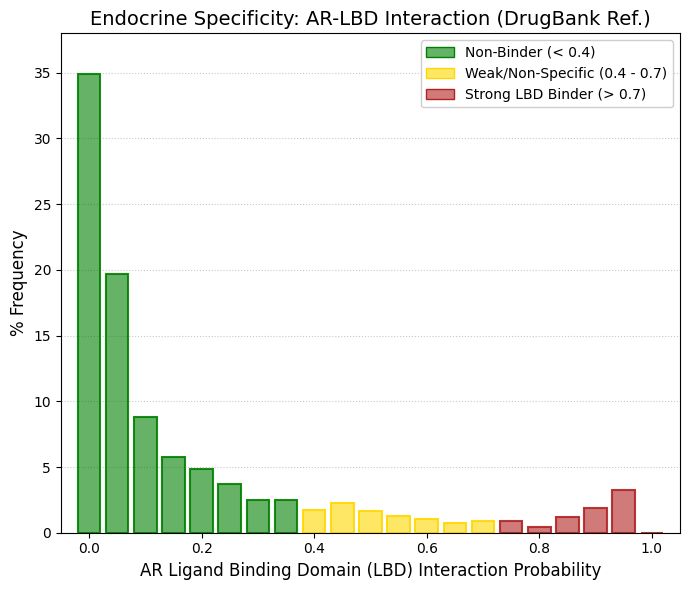
AR-LBD: The Androgen Receptor Ligand Binding Domain.
To contextualize the endocrine disruption profile of the analyzed compounds, the probability of specific interaction with the ligand-binding domain of the androgen receptor (AR-LBD) was evaluated using the DrugBank database as a reference dataset. The resulting probability distribution exhibited a population mean of 0.17 and a pronounced clustering of compounds within the region corresponding to negligible interaction (probability ≤ 0.1). This distribution indicates that, for the majority of molecules in the reference chemical space, the likelihood of direct engagement with the androgen receptor ligand-binding pocket is minimal.
Importantly, the predictive model demonstrated an appropriate level of biological discrimination by correctly identifying clinically approved androgenic ligands. These compounds appeared as a distinct secondary enrichment within the highest probability decile (0.90–1.0), reflecting their well-established capacity to bind and activate the androgen receptor. The presence of this high-probability peak corresponding to known androgenic agents provides an internal consistency check for the predictive framework.
Consequently, the model’s ability to differentiate between non-interacting compounds and bona fide androgen receptor ligands retrospectively supports the reliability of the safety predictions obtained for our compound library with respect to endocrine targets. This validation step strengthens the interpretation that the low predicted interaction probabilities observed for the majority of molecules likely reflect a genuine absence of androgen receptor liability rather than a systematic bias of the model. |
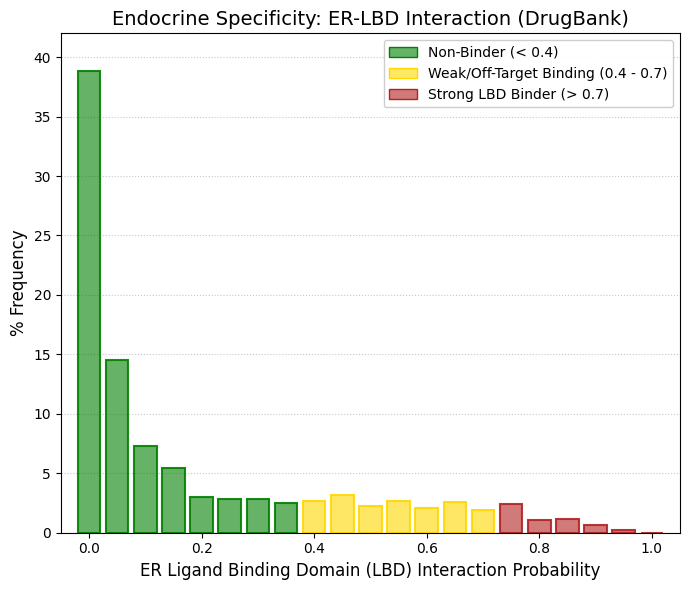
ER-LBD: The Estrogen Receptor Ligand Binding Domain.
When the probability distribution obtained for the estrogen receptor ligand-binding domain (ER-LBD) is compared with that previously observed for the androgen receptor (AR-LBD), several structural differences emerge that substantially enrich the interpretation of the endocrine safety profile. As in the AR analysis, the majority of therapeutically safe and widely used drugs—such as paracetamol and numerous statins—are strongly concentrated in the lowest probability interval. More than 60% of the compounds exhibit a predicted interaction probability between 0 and 0.1, indicating a very low likelihood of occupying the estrogen receptor binding pocket. This pronounced accumulation in the leftmost region of the distribution reflects the general absence of estrogenic activity among the majority of clinically approved pharmaceuticals and establishes a baseline of endocrine safety within the DrugBank reference chemical space. However, in contrast to the sharply declining distribution observed for the androgen receptor model, the ER-LBD probability profile displays a noticeably broader tail extending toward intermediate and moderately high probabilities. Instead of rapidly approaching zero frequency beyond the low-probability region—as occurred in the AR-LBD distribution—the ER-LBD model shows a persistent “fat tail” in the range of approximately 0.4 to 0.75. Within this interval, each probability bin maintains frequencies of roughly 2-3%, producing a continuous, low-level signal of moderate predicted interactions across a substantial portion of the dataset. This pattern indicates that a non-negligible fraction of approved drugs possess structural features that partially resemble estrogen receptor ligands or that allow them to interact weakly with the receptor’s binding cavity. This phenomenon is consistent with well-established structural and biochemical characteristics of the estrogen receptor. The ligand-binding pocket of the ER-LBD is known to be larger, more conformationally flexible, and considerably more permissive than that of the androgen receptor. As a consequence, it can accommodate a much wider diversity of chemical scaffolds. This property underlies the receptor’s well-documented susceptibility to binding structurally unrelated compounds, including phytoestrogens, environmental xenoestrogens, and numerous pharmaceuticals that may exert unintended off-target estrogenic effects. The predictive model appears to capture this biological reality, assigning intermediate or moderate interaction probabilities to a larger number of DrugBank compounds in accordance with the receptor’s experimentally observed ligand promiscuity. From a methodological perspective, this behavior of the ER-LBD model provides an informative benchmark for interpreting endocrine interaction predictions. Using DrugBank-approved drugs as a reference chemical space, the AR-LBD model (mean probability = 0.17) exhibited a highly segregated distribution characterized by a clear terminal peak corresponding to known androgenic ligands. In contrast, the ER-LBD model (mean probability = 0.16) displayed a broader probabilistic tail across intermediate ranges (0.4-0.75), reflecting the greater structural tolerance of the estrogen receptor binding pocket. This algorithmic behavior faithfully reproduces the biological differences between both nuclear receptors. Within this clinically grounded reference framework, the complete absence of predicted affinity observed for our compound library toward both AR-LBD and ER-LBD is particularly noteworthy. The result is especially significant in the case of the estrogen receptor, a target that is well known for its capacity to interact with chemically diverse ligands. Consequently, the strict clustering of our molecules at the lowest probability interval suggests an exceptionally robust safety and selectivity profile, indicating a negligible risk of unintended endocrine modulation even when evaluated against highly permissive nuclear hormone receptors such as ER. |
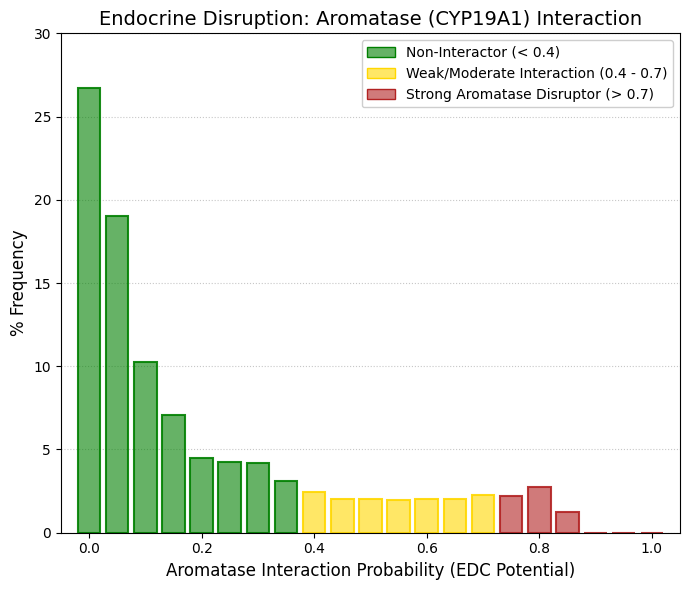
Aromatase.
If a drug inadvertently inactivates aromatase, it triggers a collapse in estrogen levels and a concomitant accumulation of testosterone, inducing virilization, severe osteoporosis, and metabolic disturbances. Conversely, aromatase inhibitors (such as letrozole or anastrozole) represent the gold-standard treatment for hormone-dependent breast cancer. The application of Safety-by-Design principles to aromatase (CYP19A1) originates from the recognition that unintended interactions with steroidogenic enzymes can trigger systemic endocrine disruption. A key regulatory milestone was the Detailed Review Paper on Aromatase (2005), which consolidated experimental and toxicological evidence demonstrating that aromatase represents a sensitive molecular target for numerous xenobiotics. By establishing aromatase inhibition as a mechanistically defined endocrine disruption pathway, this document effectively compelled regulatory agencies and the pharmaceutical and chemical industries to incorporate aromatase-related endpoints into safety evaluation frameworks. As a result, CYP19A1 became recognized not merely as a therapeutic target but also as a potential systemic liability that must be proactively assessed during compound development. Experimental evidence for this concern had already emerged earlier. In a landmark toxicological screening study, Screening of selected pesticides for inhibition of CYP19 aromatase activity in vitro demonstrated that numerous compounds originally designed as pesticides or antifungal agents strongly inhibit human aromatase. Subsequent mechanistic work, such as Azole fungicides affect mammalian steroidogenesis by inhibiting sterol 14α-demethylase and aromatase, further showed that many azole fungicides interfere with mammalian steroidogenesis by binding to the heme iron of cytochrome P450 enzymes, including CYP19A1. These findings established a structural toxicology paradigm: molecules designed to disrupt fungal sterol biosynthesis often possess the coordination chemistry required to interact with the catalytic heme center of human P450 enzymes. Consequently, modern antiviral and antifungal drug discovery programs routinely include explicit demonstrations that candidate molecules do not inadvertently bind to or inhibit human aromatase. A further conceptual expansion arose from the recognition that aromatase activity is not confined to gonadal tissues. CYP19A1 is expressed in extragonadal sites, including bone, adipose tissue, and the brain, where estrogens are produced locally and act through paracrine and intracrine signaling mechanisms. In these contexts, aromatase-derived estrogens regulate essential processes such as bone remodeling, neuronal plasticity, and metabolic homeostasis. Therefore, systemic pharmacological inhibition of aromatase does not merely reduce circulating estrogen levels; it disrupts localized estrogen signaling networks that maintain tissue integrity. This mechanistic understanding explains the biological basis of iatrogenic osteoporosis and other endocrine-related adverse effects associated with unintended aromatase inhibition. Within a Safety-by-Design framework, early evaluation of CYP19A1 binding and catalytic interference is therefore essential to prevent pharmacological disruption of these critical paracrine regulatory systems. |
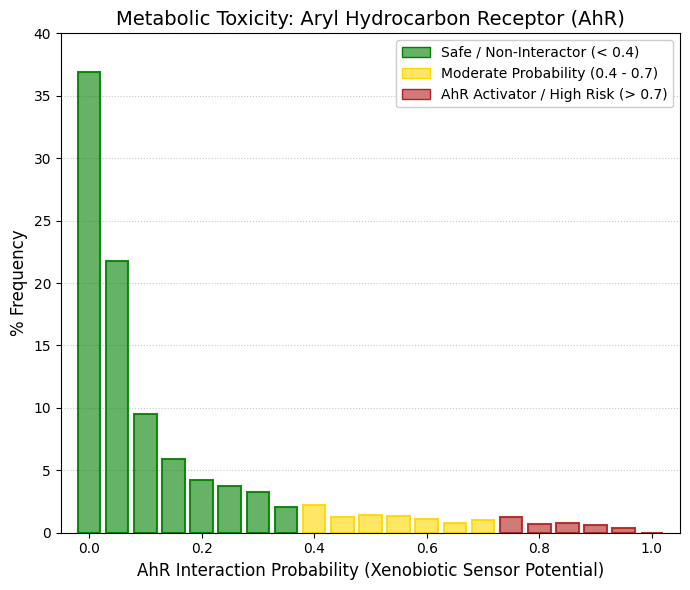
AhR: The aryl hydrocarbon receptor.
The Aryl Hydrocarbon Receptor (AhR) serves as the primary cellular sensor for environmental pollutants, including tobacco-derived benzopyrenes and dioxins. Upon ligand binding and activation, the AhR translocates to the cell nucleus, triggering a massive upregulation of cytochrome P450 enzymes—particularly CYP1A1, CYP1A2, and CYP1B1. This induction accelerates the hepatic metabolism of concomitantly administered medications, potentially leading to severe drug-drug interactions (DDIs). Furthermore, concerning carcinogenic activation, the enzymes induced by the AhR cascade frequently metabolize otherwise benign molecules into highly reactive carcinogens. Our analysis highlights a very low probability of AhR activation for the vast majority of approved drugs included in DrugBank (mean = 0.15). Specifically, over 58% of these drugs exhibit a negligible probability (ranging from 0 to 0.05) of interacting with the AhR. The frequency distribution drops drastically beyond this point, leaving an almost null percentage of compounds in the high-activation zone. This confirms that the majority of DrugBank therapeutics do not share structural similarities with hazardous polyaromatic environmental pollutants, such as dioxins or polychlorinated biphenyls (PCBs). Given that the AhR acts as a master transcription factor for the induction of Phase I metabolic enzymes (CYP1 family), this low predicted affinity suggests that these compounds carry a minimized risk of triggering large-scale enzymatic cross-induction. Consequently, this indicates a highly favorable safety profile regarding drug-drug interactions (DDIs) and prevents the potential bioactivation of environmental procarcinogens dependent on the AhR signaling cascade. |
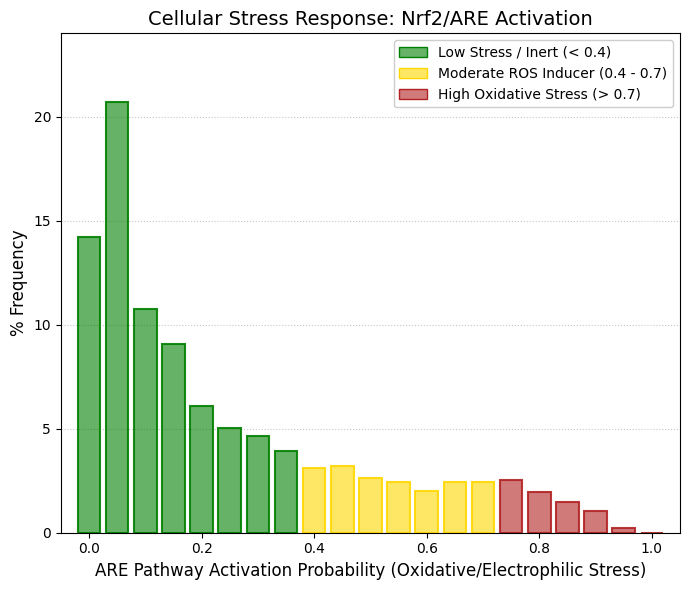
ARE: antioxidant response element.
The distribution of predicted oxidative stress activation probabilities exhibits a pronounced peak in the lowest risk interval (0-0.15), which encompasses more than 54% of the compounds contained in the DrugBank library. This marked concentration in the lower deciles indicates that the majority of approved or investigational drugs behave as biologically “silent” entities with respect to oxidative stress signalling, meaning that they do not significantly perturb intracellular redox homeostasis under basal conditions. From a pharmacological perspective, such behaviour is expected and desirable, as excessive activation of cellular stress pathways is typically associated with off-target toxicity rather than with the intended pharmacodynamic mechanism of action. In contrast, the upper tail of the oxidative stress distribution displays a gradual and sustained decline rather than an abrupt cutoff. A non-negligible fraction of molecules populates the moderate probability range (0.4-0.7), with a smaller subset extending into the high activation region (>0.7). This pattern is entirely consistent with the realities of drug metabolism and xenobiotic biotransformation. Many pharmacologically active compounds undergo oxidative metabolism in the liver, particularly through cytochrome P450-mediated pathways, generating transient reactive intermediates capable of inducing a mild secondary oxidative stress response. Such moderate activation does not necessarily imply intrinsic toxicity but rather reflects physiological detoxification processes. To systematically evaluate the potential for non-specific cellular damage, the activation of the Antioxidant Response Element pathway (ARE/Nrf2) was modelled as a proxy for oxidative stress and electrophilic reactivity. The ARE/Nrf2 axis functions as a primary intracellular biosensor that detects electrophilic species and redox imbalance, subsequently triggering the transcriptional upregulation of cytoprotective genes involved in antioxidant defence and phase II detoxification. The resulting probabilistic distribution confirms that the majority of the chemical library does not induce substantial stress responses, with the population density concentrated in the lowest-risk deciles and a global mean probability of 0.25. Although a mild dispersion toward intermediate activation levels is observed, consistent with the normal oxidative metabolism of xenobiotics in hepatic tissues, the sharp decline in the highest activation decile (≥0.90) indicates a very limited presence of strongly pro-oxidant molecules or compounds prone to forming toxic covalent adducts with cellular macromolecules. Overall, this distribution suggests that most candidates within the dataset exhibit a favourable baseline safety profile characterized by low intrinsic cytotoxic potential and limited propensity to trigger excessive oxidative stress signalling. |
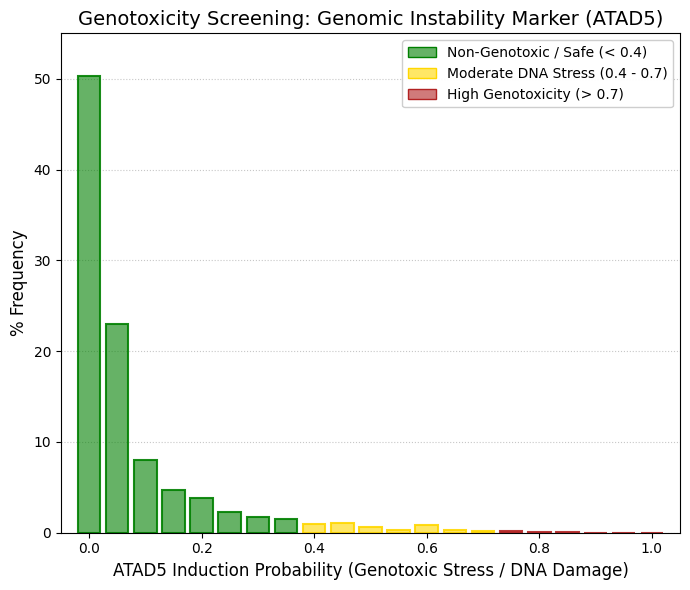
ATAD5: AAA domain proteins in the ATPase family 5.
The protein ATAD5 (also known as ELG1) serves as a critical molecular biomarker of genomic instability, as its overexpression correlates with structural DNA damage events, such as strand breaks and stalled replication forks. While ATAD5 activation is a targeted mechanism in cytotoxic oncology, it represents an unacceptable safety liability for non-oncological therapeutic indications due to its association with mutagenesis and secondary malignancies. In this study, we systematically evaluated the genomic integrity of the chemical library by modeling the probability of ATAD5 overexpression as a proxy for compound-induced replicative stress and genotoxicity. The predictive analysis revealed an exceptionally favorable safety profile, characterized by a remarkably low population mean probability of 0.07. Statistical distribution further corroborated these findings: more than 50% of the evaluated compounds exhibited a zero probability of inducing ATAD5, and over 81% fell within the lowest risk decile (p ≤ 0.1). Notably, the high-probability region (p ≥ 0.9) was entirely unpopulated, effectively excluding the presence of potent clastogens, mutagens, or unintended cytotoxic agents within the dataset. From a regulatory toxicology perspective, this distribution suggests that the molecules lack the structural motifs typically associated with DNA adduct formation or chromosomal instability. The near-total absence of significant replicative stress signals confirms that the library aligns with preclinical safety requirements for diverse therapeutic areas. Consequently, these findings support the suitability of the chemical space for further pharmacological development, demonstrating a minimal risk of inducing genomic perturbations. |

p53.
p53 is a transcription factor that continuously surveys the intracellular environment. Under normal physiological conditions, when the cell is healthy, p53 levels remain extremely low or undetectable due to rapid degradation. However, when a drug or chemical agent induces DNA damage, severe oxidative stress, or hypoxia, p53 becomes stabilized and accumulates within the cell. Once activated, it triggers a critical cellular decision: either cell-cycle arrest to allow DNA repair or programmed cell death (apoptosis) if the damage is irreparable. For this reason, activation of the p53 pathway in toxicological screening assays is considered one of the most significant warning signals, unless the compound is intentionally designed as a cytotoxic anticancer agent. The distribution observed in the dataset strongly supports a favorable safety profile. More than 62% of the drugs included in DrugBank fall within the first two probability bins (0 and 0.05), indicating that they do not measurably activate the p53 pathway. The distribution tail declines rapidly, and beyond 0.8 probability, only about 0.4% of compounds are present. Notably, no compounds appear in the highest-risk region (0.95-1.0). To further consolidate the safety assessment regarding DNA damage and cytotoxic stress, the induction of the p53 pathway (often referred to as the "guardian of the genome") was evaluated alongside the ATAD5 biomarker, which is associated with replicative stress and genomic instability. The analysis of predicted p53 activation reveals a strongly left-skewed distribution toward safety, with a population mean of approximately 0.12. More than 62% of the DrugBank library exhibits a probability below 0.1 of triggering apoptotic signaling or cell-cycle arrest. Importantly, the absence of predicted p53 stabilization, together with the lack of ATAD5 overexpression, provides convergent evidence that these compounds do not induce double-strand DNA breaks, severe DNA adduct formation, or genomic instability. Collectively, these findings argue against clastogenic or genotoxic collateral activity, reinforcing the conclusion that the compounds display a non-genotoxic safety profile. |
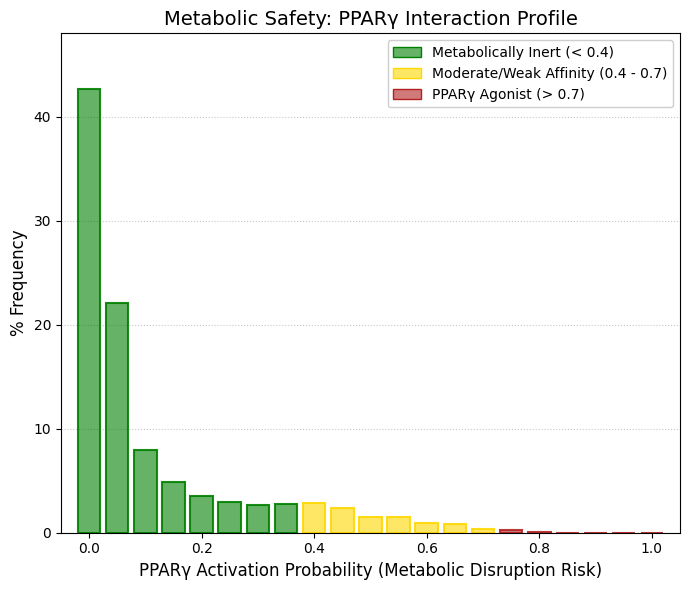
PPARγ: Peroxisome proliferator-activated receptors (PPARs).
PPARγ (Peroxisome Proliferator-Activated Receptor gamma) is a nuclear transcription factor that functions as a master regulator of adipogenesis and lipid and glucose metabolism. In pharmacology, this receptor is widely known as the therapeutic target of the thiazolidinedione class of antidiabetic drugs, such as pioglitazone and rosiglitazone, which act as potent oral insulin sensitizers. However, unintended activation of PPARγ by compounds that were not designed to target this receptor represents a significant safety concern. Non-specific activation of this pathway may lead to serious metabolic side effects, including rapid weight gain, fluid retention (edema), and an increased risk of congestive heart failure. For this reason, avoiding off-target interaction with PPARγ is an important objective during early-stage safety profiling of drug candidates. The distribution observed in the dataset indicates a highly favorable safety profile with respect to this metabolic pathway. More than 64% of the molecules (combining the 0 and 0.05 probability bins) appear metabolically inert with respect to PPARγ activation. The probability of interaction decreases sharply across higher bins, and no compounds are observed above the 0.85 probability range, indicating the absence of molecules with strong predicted agonist activity toward this receptor. To further assess potential off-target metabolic disturbances, the risk of non-specific activation of PPARγ, a key transcriptional regulator of lipid metabolism and glucose homeostasis, was evaluated through in silico screening. The results revealed a strongly left-skewed distribution toward negligible interaction, with a population mean of approximately 0.11 and more than 64% of the library exhibiting activation probabilities ≤ 0.05. Notably, no compounds were detected within the high-affinity agonist range (≥ 0.85). This marked selectivity and absence of structural promiscuity toward the PPARγ ligand-binding pocket substantially reduces the preclinical risk associated with unintended activation of this pathway. Consequently, the dataset shows minimal likelihood of adverse metabolic outcomes, such as aberrant adipogenesis, peripheral edema, or secondary cardiovascular complications, reinforcing the overall metabolic safety profile of the compounds analyzed. |
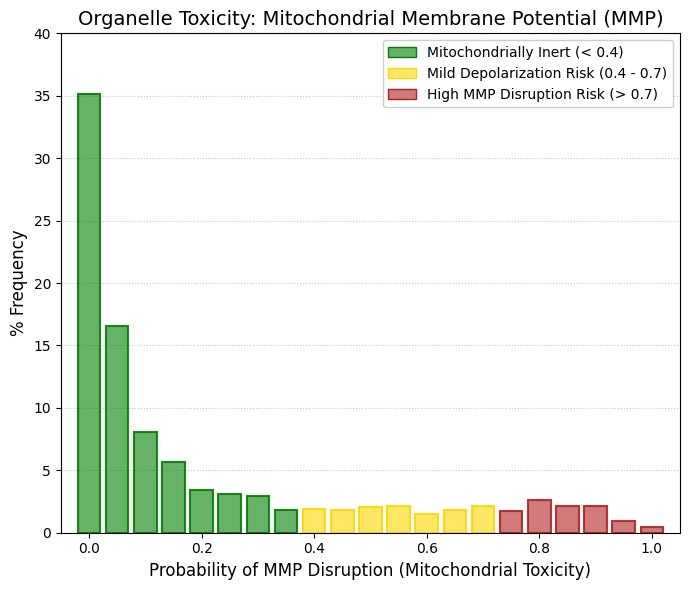
MMP: Mitochondrial membrane potential.
Mitochondria generate cellular ATP through the reoxidation of NADH and FADH2. To produce this energy, the electron transport chain (ETC) pumps protons into the intermembrane space, establishing an essential electrochemical gradient. This gradient is subsequently utilized by the inner mitochondrial membrane ATPase to synthesize ATP from ADP and Pi. If a pharmacological agent disrupts this membrane potential, either by acting as an uncoupling agent or by inhibiting ETC complexes, the cell undergoes severe energy depletion, immediately triggering the intrinsic pathway of apoptosis (programmed cell death). Consequently, mitochondrial toxicity remains a primary cause of drug attrition during late-stage clinical trials, frequently manifesting as severe hepatotoxicity or cardiotoxicity due to the exceptionally high metabolic demands of the liver and heart. Organelle-level cytotoxicity was assessed by monitoring the potential impact on the Mitochondrial Membrane Potential (MMP), a critical surrogate parameter for ETC viability and ATP synthesis. The in silico evaluation revealed a robust mitochondrial biosafety profile across the database. Over 51.6% of the compounds are concentrated within the two lowest interaction probability deciles (≤ 0.05), anchoring the population mean at 0.23. By extending this margin to include the low-probability zone (< 0.4), it is evident that the vast majority of the drugs included in DrugBank preserve mitochondrial integrity and are classified as inert regarding the induction of mitochondrial depolarization. Unlike other toxicological parameters that drop abruptly to zero, the MMP distribution displays a constant, low-frequency dispersion or "tail" toward moderate and high probability ranges (accounting for approximately 1.5% to 2.6% per bin). This observation is highly realistic from a biological perspective. Within any comprehensive drug library, there is inevitably a small proportion of lipophilic or weakly cationic compounds. Due to their inherent physicochemical properties, these molecules tend to accumulate within the mitochondrial matrix, subsequently inducing mild polarity alterations. Overall, the overarching inertness of the library toward MMP disruption suggests a significantly reduced risk of inducing toxicities in organs with high metabolic requirements, effectively minimizing the potential for drug-induced cardiotoxicity and mitochondrial-mediated liver damage in future screening applications. |
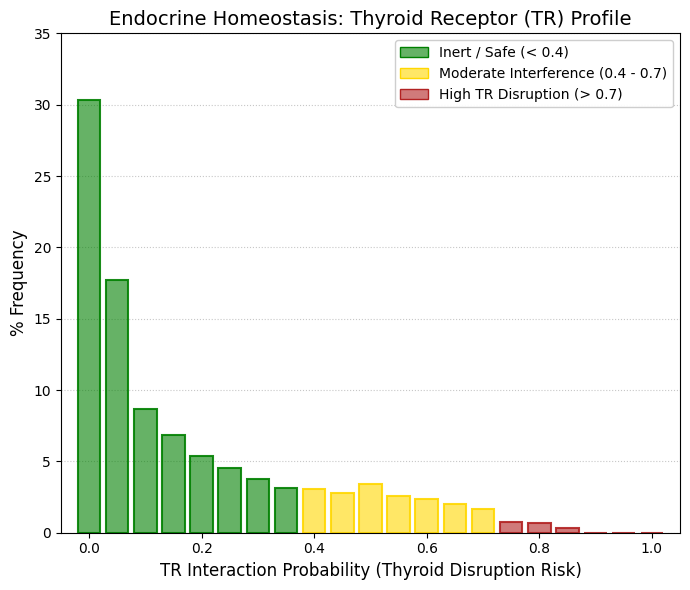
TR: Thyroid hormone.
Thyroid hormone (TH) is synthesized in the thyroid gland and exists primarily in the form of thyroxine (3,5,3,5-tetraiodothyronine, T4) and triiodothyronine (3,5,3,-triiodothyronine, T3). While T4 is the predominant circulating form, T3 serves as the biologically active hormone in tissues, generated through the deiodination of T4. T3 binds to thyroid hormone receptors (TRs) to regulate fundamental physiological and pathological processes, including cellular metabolism, growth, and development. Consequently, an imbalance in thyroid hormone homeostasis can lead to severe metabolic disorders and increased susceptibility to obesity.
If a pharmacological agent interferes with TRs, either through receptor blockade or uncontrolled activation, the resulting adverse effects are systemic and severe:
TR Antagonism: Induces pharmacological hypothyroidism, clinically characterized by chronic fatigue, weight gain, depression, and bradycardia.
TR Agonism: Triggers pharmacological hyperthyroidism, leading to extreme weight loss, tachycardia, and potentially fatal arrhythmias. Given these profound systemic implications, evaluating the potential of novel or existing molecules to act as TR regulators is of paramount importance in drug safety screening.
The predictive modeling of TR interference reveals a highly favorable safety profile for the evaluated library. Specifically, nearly 48% of the compounds cluster within the first two probability bins (0 to 0.05), indicating a state of dominant inactivity. When expanding the analysis to the designated high-safety zone (< 0.2), the model encompasses over 63% of the drugs included in DrugBank. Most notably, the probability frequency drops to an absolute 0.0% at the extreme high-risk threshold (0.9 to 1.0). This definitive lack of high-probability interaction confirms that there are no potent, unintended thyroid agonists or antagonists hidden among the approved therapeutic agents within the DrugBank database. Ultimately, these findings validate the endocrine safety of the library concerning the thyroid axis. |
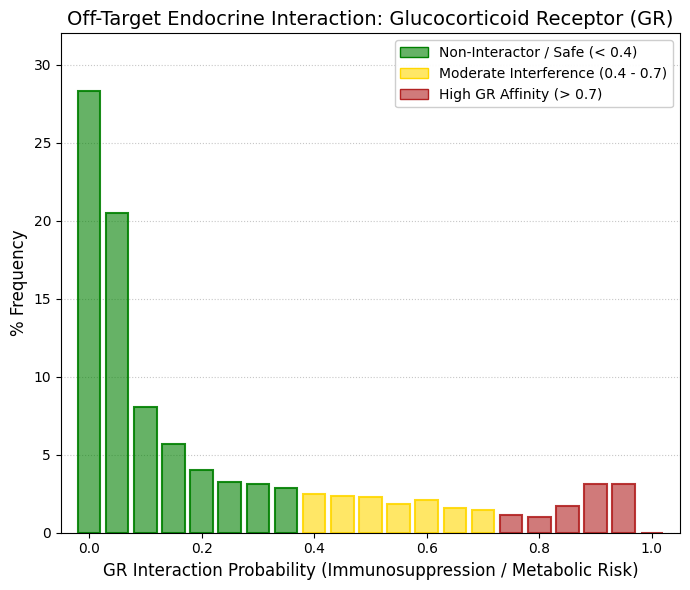
GR: Glucocorticoids.
The glucocorticoid receptor (GR) is a nuclear transcription factor that regulates large-scale systemic responses to physiological stress. When activated by endogenous glucocorticoids, it orchestrates multiple biological processes including immune modulation, glucose metabolism, and catabolic energy mobilization. However, chronic or unintended activation of GR by drugs not designed to target this receptor can lead to severe adverse effects, including drug-induced Cushing’s syndrome, profound immunosuppression with increased susceptibility to infections, hyperglycemia, osteoporosis, and muscle atrophy. The distribution observed in the dataset indicates a predominantly safe interaction profile, but also reveals a chemically informative pattern. Approximately 49% of the molecules (probability bins 0 and 0.05) show no predicted interaction with GR. When considering the broader low-risk region (probability < 0.4), more than 75% of the drugs included in DrugBank appear to lack significant immunosuppressive risk associated with GR activation. Unlike other nuclear receptors where the distribution tail approaches zero at higher probabilities, a small but noticeable increase appears in the high-probability region, with 3.14% of compounds around 0.90 and 3.10% around 0.95. This suggests the presence of a restricted subpopulation (~6-7%) of molecules that structurally resemble glucocorticoids, likely due to shared polycyclic lipophilic scaffolds or hydrogen-bonding patterns reminiscent of steroidal ligands. To further evaluate the potential impact on the hypothalamic-pituitary-adrenal (HPA) axis, off-target interactions with the glucocorticoid receptor were assessed through in silico prediction. The population-level distribution across the DrugBank chemical space shows a generally favorable safety profile, with a mean probability of approximately 0.22 and roughly 75% of molecules displaying low or negligible predicted interaction (≤ 0.35). Importantly, the model also identified a restricted subset of compounds (~6.2%) with high predicted affinity for GR (0.90-0.95). This bimodal pattern not only supports the sensitivity of the predictive model in recognizing steroid-like or highly lipophilic scaffolds, but also highlights the value of in silico screening approaches for the early identification and filtering of compounds that could otherwise induce undesired glucocorticoid-like effects, such as Cushingoid manifestations or unintended immunosuppression, during preclinical development. |
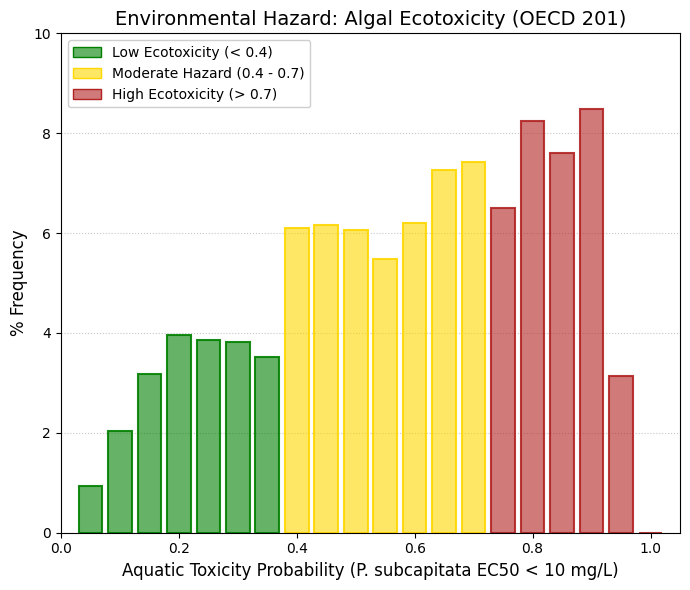
Aquatic toxicity (P. subcapitata).
Pseudokirchneriella subcapitata is a unicellular freshwater microalga that forms a fundamental component of aquatic primary productivity, acting as a basal organism in freshwater food webs. Because of its ecological importance and rapid growth rate, it is widely used as a biological indicator in the OECD Test No. 201, a standardized assay designed to evaluate the inhibitory effects of chemicals on algal growth. This test is extremely sensitive: it measures whether very small concentrations of a compound, typically EC₅₀ values below 10 mg/L, are sufficient to significantly inhibit algal proliferation. In contrast to many human-targeted toxicological endpoints, the distribution observed for this ecotoxicological parameter reveals a markedly different pattern. More than 50% of the compounds in the DrugBank-approved dataset cluster within the high-probability toxicity range (0.6-0.95), suggesting a substantial likelihood of growth inhibition in P. subcapitata. This result is toxicologically plausible. Many pharmaceuticals, particularly antibiotics, antifungal agents, cytotoxic anticancer drugs, and highly lipophilic membrane-permeable molecules, are specifically designed to interfere with fundamental biological processes such as DNA replication, protein synthesis, or membrane integrity. These mechanisms are highly conserved across biological systems and therefore can disrupt the cellular physiology of photosynthetic microorganisms. Consequently, compounds that are clinically safe for humans at therapeutic doses may still exert significant ecological toxicity when released into aquatic environments. Microalgae are particularly vulnerable because they lack the complex detoxification pathways and pharmacokinetic buffering systems present in higher organisms. The observed distribution therefore illustrates an important principle in modern toxicology: human pharmacological safety and environmental safety are not equivalent endpoints. The predictive models capture this distinction effectively. The strong skew toward higher toxicity probabilities in the algal endpoint demonstrates that in silico ecotoxicology tools are capable of discriminating between human biosecurity and environmental hazard, identifying compounds that, while therapeutically acceptable in humans, may still pose significant risks to aquatic primary producers and, by extension, to the stability of aquatic ecosystems. |
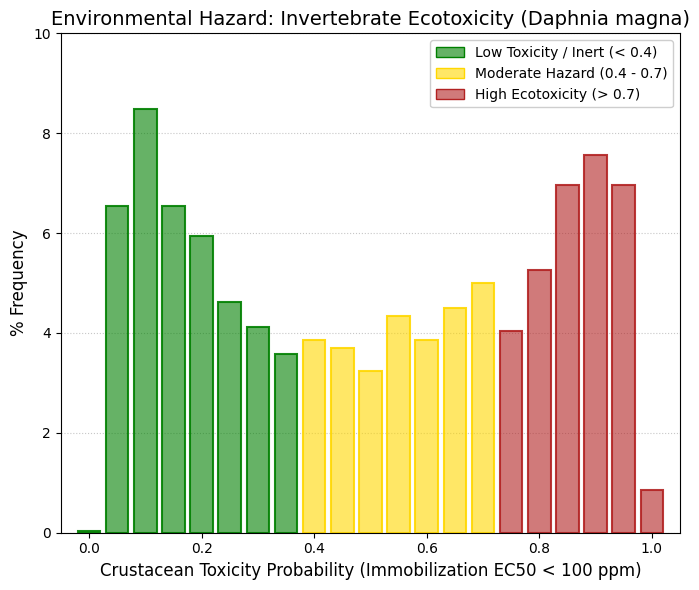
Aquatic toxicity (Crustaceans).
Continuing with the ecotoxicological screening, the risk of acute aquatic toxicity in freshwater crustaceans was assessed utilizing the locomotor inhibition endpoint in Daphnia magna (EC50 ≤ 100 ppm). Diverging from the toxic bias observed in the algal model, the predicted interaction with D. magna exhibited a markedly heterogeneous population distribution (mean = 0.50), spanning a broad probabilistic spectrum. The coexistence of significant compound densities within both the biosafety deciles (0.05 - 0.20) and the high ecotoxicological risk deciles (0.80 - 0.95) underscores a profound structural diversity within the evaluated chemical library. This finding facilitates an effective early stratification of drug candidates. Specifically, molecular scaffolds exhibiting high lipophilicity or those prone to interacting with neuromuscular signaling pathways conserved across invertebrates can be systematically filtered out or structurally optimized. This strategic approach significantly enhances the environmental sustainability profile of the candidates, aligning with Green Chemistry principles, long before advancing to in vivo development phases. |
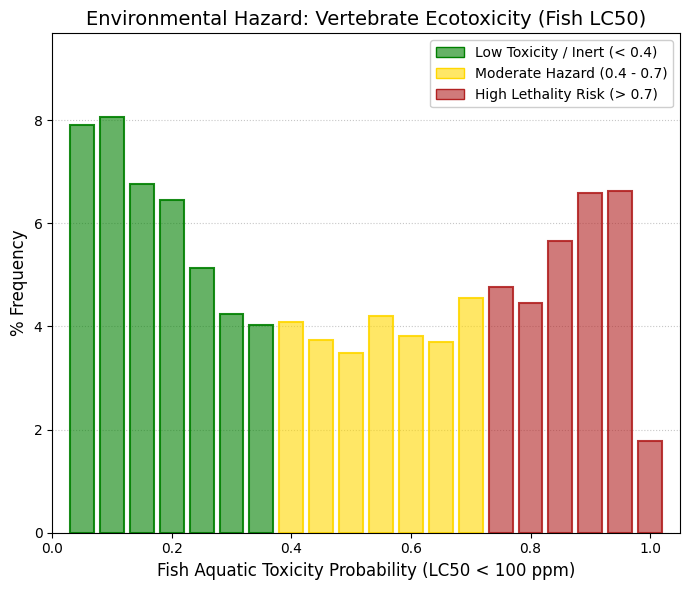
Aquatic toxicity (Fish).
The Aquatic Toxicity (Fish) parameter serves as a primary ecotoxicological indicator for assessing the potential environmental impact of chemical compounds released into aquatic ecosystems. Within this context, the standard endpoint is the LC50 (Lethal Concentration 50%), which represents the concentration of a substance required to cause mortality in 50% of exposed organisms over a specified experimental period. In predictive environmental toxicity modeling, a 100 ppm threshold is frequently employed to classify molecules into toxic or non-toxic categories for fish. This provides a valuable metric for preliminary Environmental Risk Assessment (ERA) during the early stages of bioactive compound design and selection. Analysis of this parameter across the approved drugs within the DrugBank database reveals a widely dispersed, biphasic probability distribution, with a population mean approaching 0.49. This indicates substantial heterogeneity in the ecotoxicological profiles of currently prescribed therapeutic molecules:
The Biosafety Cluster: Approximately 34% of the compounds cluster within the low-probability deciles for aquatic toxicity (≤ 0.25). This suggests that a considerable fraction of these drugs exhibits a relatively favorable environmental biosafety profile. These molecules likely possess lower environmental persistence, reduced effective lipophilicity, or a decreased propensity to interact with conserved physiological targets in aquatic organisms.
The High-Risk Cluster: Conversely, the analysis highlights a significant accumulation of compounds within the high-probability toxicity ranges (> 0.80), pointing to a substantial subset of drugs with elevated predictive lethality in fish.
This phenomenon underscores an inherent tension in pharmacological design: the physicochemical properties that optimize biological target affinity, cellular permeability, or metabolic stability often concurrently increase the likelihood of bioaccumulation or interaction with conserved physiological pathways in aquatic species. Consequently, compounds that are clinically safe for humans may still pose non-trivial ecotoxicological risks when they enter the environment through hospital effluents, municipal wastewater, or incomplete degradation in water treatment plants. From the perspective of drug discovery and development, this parameter is gaining critical relevance within the paradigms of Green Pharmacology and Safety-by-Design. The early identification of candidates with a high probability of aquatic toxicity enables strategic structural modifications aimed at reducing environmental persistence, modulating lipophilicity, or limiting bioaccumulation without compromising pharmacological efficacy. Furthermore, integrating in silico ecotoxicity models into the initial stages of the development pipeline significantly reduces the likelihood of advancing environmentally unfavorable compounds into late-stage research. |
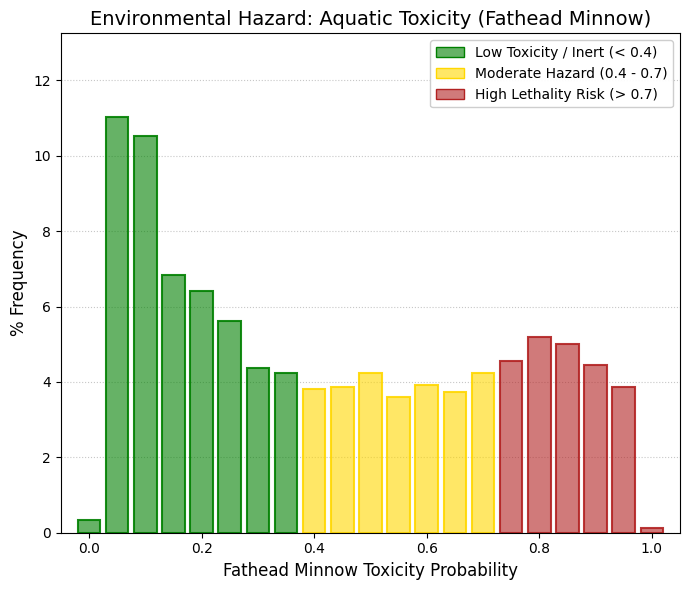
Aquatic toxicity (Fathead minnow).
Continuing the evaluation of aquatic vertebrates, we directed our focus toward a highly specific and critical model: Pimephales promelas (commonly known as the fathead minnow). This small teleost species serves as a widely accepted reference organism in ecotoxicology and regulatory toxicology, and it is extensively used by both the United States Environmental Protection Agency and the Organisation for Economic Co-operation and Development for assessing acute aquatic toxicity, chronic toxicity, and endocrine disruption in freshwater ecosystems (Martin & Young, 2001; OECD Test Guideline 229). The use of P. promelas has become a cornerstone in aquatic hazard assessment because standardized protocols—including early life stage assays and short-term reproduction tests—have demonstrated high reproducibility and regulatory relevance for evaluating chemical toxicity in fish models (Norberg & Mount, 1985). Because different fish species possess distinct metabolic capacities and toxicological tolerances, evaluating compounds in the fathead minnow provides an important species-specific benchmark for aquatic hazard characterization. Indeed, comparative toxicological studies have shown that P. promelas can display sensitivity patterns that differ from other teleost models depending on chemical structure, mode of toxic action, and bioaccumulation potential (Kavanagh et al., 2012; Bauer et al., 2017). Consequently, demonstrating low predicted toxicity in this species provides a strong indication that a compound lacks broad baseline narcotic toxicity and may have limited potential for lethal bioaccumulation in freshwater vertebrates. In this specific predictive model, the statistical weight of the distribution leans heavily toward the biosafety spectrum. The Low-Risk Spectrum: over 21% of the approved drugs included in DrugBank cluster within the first two probability bins (0.05 and 0.10). When expanding this margin to encompass the entire low-risk zone (probability < 0.4), the model captures nearly 45% of the evaluated molecules. Rather than exhibiting the dramatic spike in the high-lethality zone (> 0.8) observed in broader fish toxicity models, the fathead minnow distribution flattens into a consistent plateau, displaying only a mild undulation in the high-risk region. Such discrepancies, where molecules exhibit higher toxicity in generalized fish models but lower predicted lethality in P. promelas, are consistent with well-recognized interspecies variability in metabolic detoxification pathways, uptake kinetics, and species-specific target interactions. Ultimately, the higher predicted tolerability in P. promelas suggests that a substantial fraction of the therapeutic library lacks non-specific baseline toxicity (narcosis) and avoids lethal accumulation in this sentinel species. This observation strengthens the environmental safety profile of the evaluated compounds and supports their ecological compatibility within a safety-by-design framework for pharmaceutical development. |
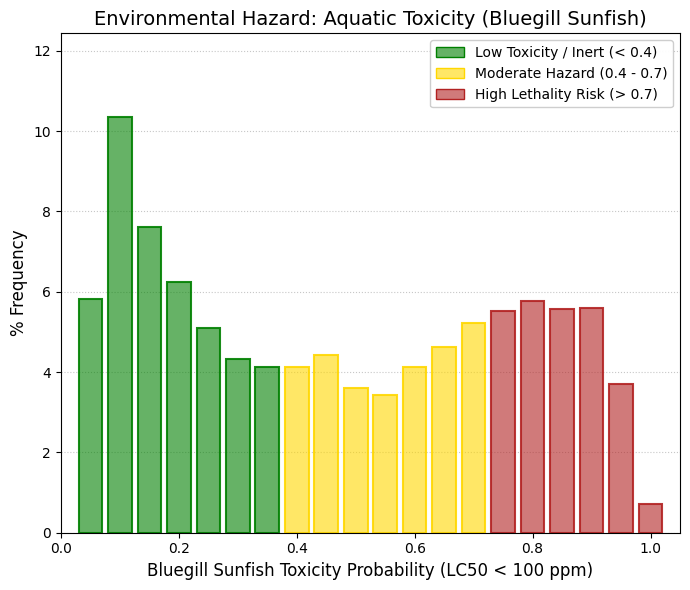
Aquatic toxicity (Bluegill sunfish).
Lepomis macrochirus (bluegill sunfish) represents one of the key vertebrate reference species in regulatory ecotoxicology, complementing Pimephales promelas within frameworks required by agencies such as the European Chemicals Agency (REACH) and the United States Environmental Protection Agency. In contrast to the fathead minnow (family Cyprinidae), the bluegill (family Centrarchidae) occupies distinct ecological niches and exhibits relevant physiological differences, particularly in its biotransformation systems, including variations in the expression and activity of branchial and hepatic cytochrome P450 enzymes, which directly influence xenobiotic sensitivity. The distribution observed for this endpoint follows an asymmetric U-shaped profile, positioned between the high safety profile observed in P. promelas and the elevated risk pattern typical of broader ichthyotoxicity models. A well-defined central valley is evident, with a progressive decline from the high-safety region (notably a peak of approximately 10.3%) toward a moderate-risk plateau (~4% per bin). This pattern indicates that only a small fraction of compounds exhibit ambiguous behavior, with most molecules being clearly classified as either low-risk or toxic, thereby reducing interpretative uncertainty. At probabilities exceeding 0.65, a renewed and sustained increase in predicted toxicity is observed, forming a stable "hill" within the high-risk region, with frequencies around 5.5% between 0.75 and 0.90. This trend suggests that specific structural scaffolds present in approved drugs possess physicochemical properties, such as lipophilicity, branchial permeability, and membrane affinity, that enable efficient translocation across the gill-water interface, leading to baseline narcosis or target-mediated toxicity.
The differential sensitivity observed across species, particularly when comparing L. macrochirus and P. promelas, highlights a fundamental principle in environmental risk assessment (ERA): no single organism can serve as a universal surrogate for ecological safety. Consequently, the integration of multi-species testing batteries and complementary in silico models is essential to minimize false negatives and to capture interspecies variability in toxicokinetics and toxicodynamics. Within this framework, predictive approaches provide a robust strategy for the early prioritization of environmentally sustainable chemical analogues, supporting green chemistry principles and more informed decision-making in drug development. |
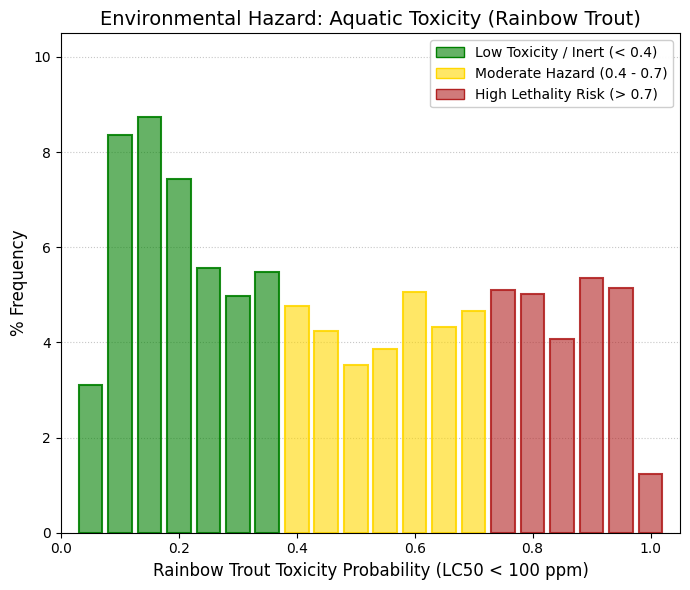
Aquatic toxicity (Rainbow trout).
To conclude the Species Sensitivity Distribution (SSD) panel in vertebrates, acute toxicity was evaluated in Oncorhynchus mykiss (rainbow trout), a stenothermal species internationally recognized for its high physiological sensitivity to xenobiotics in cold-water environments. This species exhibited a bimodal ecotoxicological distribution (mean = 0.46), consistent with its biological characteristics. While a substantial 43% of the chemical library clustered within the high-safety range (probability < 0.4), a persistent plateau of lethal risk was observed across the upper deciles (0.60-0.95). This increased susceptibility, relative to warm-water species such as Pimephales promelas, highlights the importance of O. mykiss as a conservative model—effectively representing a “worst-case scenario” in environmental risk assessment. Taken together, the triad of in silico ichthyotoxicity models supports the conclusion that the chemical library exhibits a robust baseline environmental safety profile. However, it also underscores the need to monitor specific substructures associated with lipophilic narcosis or target-mediated toxicity, particularly in vulnerable aquatic ecosystems where species with heightened sensitivity may be disproportionately affected. |
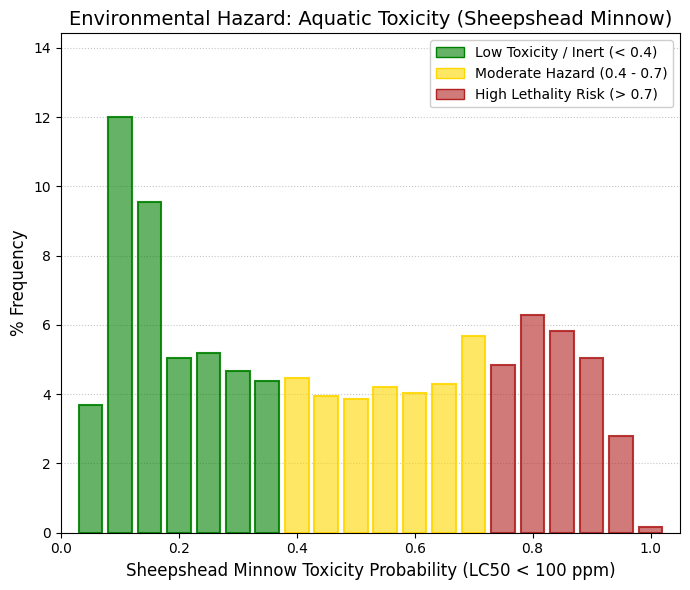
Aquatic toxicity (Sheepshead minnow).
To extend the environmental impact assessment toward estuarine and marine ecosystems, acute ecotoxicity was predicted using Cyprinodon variegatus (sheepshead minnow), an osmoregulatory model species widely employed in regulatory testing. The population distribution (mean = 0.46) revealed a high baseline tolerance across the chemical library, characterized by a pronounced density peak (>21%) within the highest biosafety quartiles. Nevertheless, as observed in freshwater models, a probability resurgence in the high-toxicity region (>0.75) was also evident. This cross-ecosystem consistency (freshwater vs. estuarine conditions) suggests that the predicted lethality for the high-risk subset of compounds is not driven by osmoregulatory disruption in euryhaline species, but rather by universal mechanisms, such as baseline narcosis or direct interactions with conserved cellular targets in teleost fish. Overall, this screening reinforces the robustness of the predictive framework in identifying structural scaffolds that are genuinely benign across the entire water column, while simultaneously flagging those associated with systemic aquatic toxicity independent of environmental salinity conditions. |
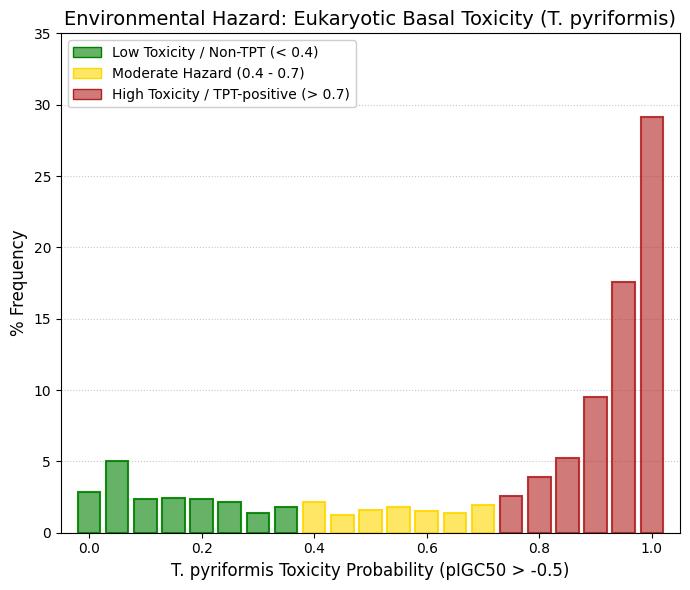
Aquatic toxicity (T. pyriformis, c).
To evaluate baseline cellular toxicity and susceptibility to membrane narcosis, the growth inhibition potential was assessed using Tetrahymena pyriformis, applying a lethality threshold of pIGC₅₀ > -0.5. In contrast to the heterogeneity and relative tolerance observed in higher vertebrate models, the distribution of the chemical library in this protozoan system revealed a strongly asymmetric and negatively skewed profile, with a population mean of 0.73. More than 61% of the compounds were identified as having a high probability (>0.85) of inducing lethal toxicity in this unicellular eukaryote. This pronounced classification as TPT-positive compounds is indicative of molecular scaffolds with high lipophilicity and a strong tendency to partition into lipid bilayers, consistent with mechanisms of baseline narcosis. While such membrane-disruptive properties are lethal to organisms lacking advanced biotransformation and detoxification systems, such as T. pyriformis, from a human pharmacological perspective they may also reflect favorable passive permeability and cellular uptake. Consequently, these results suggest that the compounds possess highly efficient membrane-crossing capabilities, which is a desirable attribute in drug design. However, they also highlight the need for careful monitoring of non-specific cytotoxicity during preclinical development to ensure an appropriate balance between permeability and safety. |
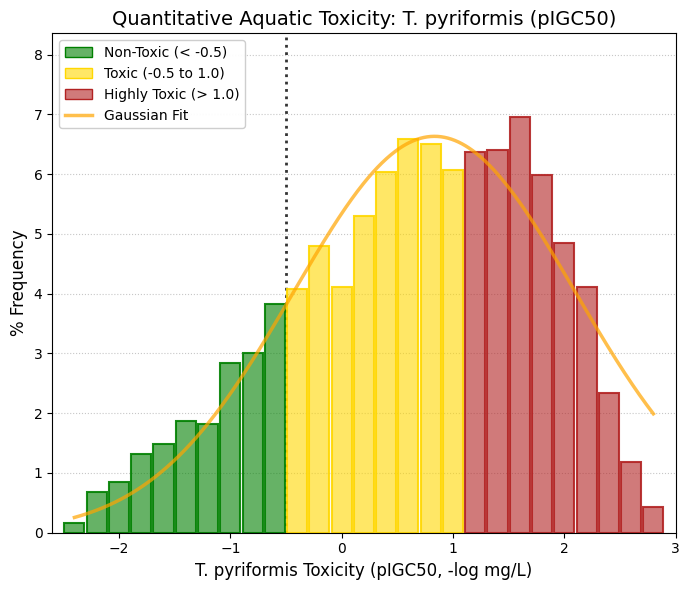
Aquatic toxicity (T. pyriformis): Unit: -log mg/L.
To corroborate the predictive baseline toxicity observed in Tetrahymena pyriformis, the pIGC50 (-log[IGC50]) of the chemical library was quantitatively modeled. In contrast to dichotomous inferences, the continuous analysis revealed a normal distribution strongly shifted toward the toxic window, demonstrating an optimal fit to a Gaussian curve (Amplitude = 6.63). The empirical population mean (0.63) is situated more than one logarithmic unit above the consensus safety threshold (pIGC50 = -0.5). Graphically, it is evident that the integral of the curve within the biosafety zone (< -0.5) represents only a minority fraction of the evaluated molecular scaffolds. Ultimately, this right-skewed normal distribution quantitatively confirms that the library possesses intrinsic physicochemical properties—predominantly elevated lipophilicity—that actively promote membrane narcosis in unicellular eukaryotes. This finding firmly reaffirms the necessity for structural optimization strategies to mitigate ecological impact, particularly in scenarios of prolonged environmental persistence. |
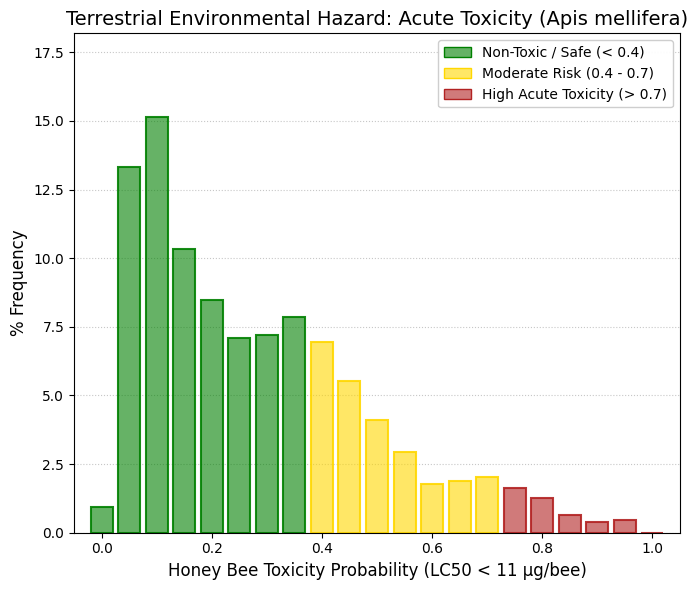
Honey bee toxicity: Apis mellifera.
To evaluate the ecotoxicological impact on terrestrial biomes, the acute contact toxicity potential was determined for the primary global pollinator, Apis mellifera (honey bee), utilizing a critical safety threshold of LC50 < 11 μ/bee. Contrary to the structural vulnerabilities observed in eukaryotic aquatic organisms (e.g., T. pyriformis), the in silico prediction revealed a highly favorable biosafety profile for this critical insect species. The population distribution exhibited a marked concentration toward the lower probability spectrum (mean = 0.28). Strikingly, approximately 40% of the chemical library clustered within the lowest toxicity probability deciles (< 0.15). Furthermore, the virtual absence of molecular scaffolds within the severe lethality band (> 0.8) indicates that the evaluated compounds lack the specific pharmacophores typically associated with the disruption of the hymenopteran nervous system, such as nicotinic or octopaminergic receptor ligands. Ultimately, these robust results provide strong assurance that the potential environmental release of these compounds, whether through wastewater effluents or agricultural leachates, would represent a minimal risk of acute lethal contact for pollinator populations. This exceptionally safe profile aligns the chemical library with the modern principles of eco-compatible drug design (Green Pharma), further validating its environmental sustainability. |
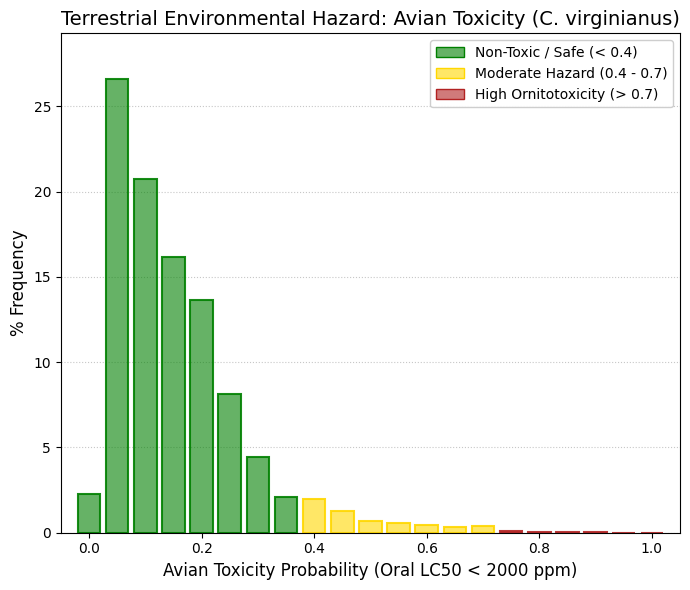
Avain toxicity: Colinus virginanus.
In regulatory ecotoxicology frameworks (e.g., EPA, EFSA), avian species are evaluated to ensure that compounds bioaccumulated in seeds, insects, or water do not induce acute lethality or large-scale reproductive failure, as historically observed with compounds such as DDT. The Colinus virginianus (northern bobwhite quail) is the standard model species due to its representative physiology and omnivorous/granivorous diet, making it highly relevant for trophic exposure scenarios. In contrast to unicellular models such as Tetrahymena pyriformis, avian species possess a highly developed hepatic system and an elevated basal metabolic rate, driven by high body temperatures and the energetic demands of flight. These features enable efficient biotransformation and excretion of xenobiotics, provided that compounds do not interfere with specific neurological or endocrine targets. The distribution of the DrugBank library demonstrates an exceptionally favorable safety profile in this model. More than 86% of the compounds fall within the highest safety region (probability < 0.25), with a pronounced peak of approximately 27% at the 0.05 probability bin. Beyond the 0.5 decile, the distribution effectively vanishes, with only residual frequencies (~0.04%) observed in the extreme high-risk region (0.8-1.0). This indicates that, relative to the critical exposure threshold of 2000 ppm, already representative of a very high oral dose, the vast majority of DrugBank compounds are functionally non-toxic via the oral route in avian species. When the chemical library is classified against this regulatory high-tolerance threshold (LC₅₀ < 2000 ppm), the predictive model yields a population mean of 0.16, reflecting a strongly right-skewed (positively asymmetric) distribution toward minimal toxicological risk. The near-total absence of compounds in the high-lethality deciles (>0.75) is particularly noteworthy. This substantial oral safety margin suggests that the evaluated scaffolds are efficiently metabolized by avian hepatic pathways and lack ornithotoxic pharmacophores. From a trophic ecotoxicology perspective, these findings indicate that the secondary bioaccumulation of such compounds is unlikely to pose an acute risk to wild bird populations, reinforcing the overall environmental compatibility of the chemical space under investigation. |
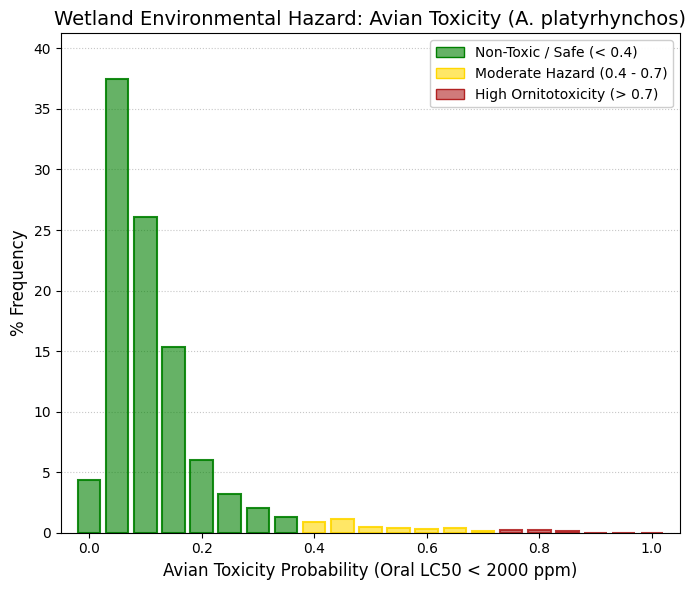
Avain toxicity: Anas platyrhynchos.
Within EPA and OECD regulatory frameworks, avian ecotoxicological assessment is never based on a single species. Instead, it systematically requires testing in both Colinus virginianus, representing terrestrial and granivorous birds, and Anas platyrhynchos (mallard), which serves as the standard model for aquatic and wetland-associated avian species. The mallard provides a complementary ecological perspective due to its omnivorous diet (including fish, aquatic invertebrates, and algae) and its direct exposure to contaminated water bodies. Unlike terrestrial birds, A. platyrhynchos may ingest xenobiotics not only through food but also via drinking water in which pharmaceuticals may be dissolved, as well as through bioaccumulated lipophilic compounds in aquatic prey. This makes it a critical model for evaluating trophic transfer and aquatic exposure pathways. The distribution observed for this endpoint confirms an exceptionally high level of safety. While approximately 86% of DrugBank compounds were already classified within the safe region in C. virginianus, in the mallard model more than 83% of compounds are tightly concentrated within the lowest probability range (0.0-0.15). Beyond the 0.4 decile, frequencies drop below 1%, and above 0.9, they are effectively zero. This sharply skewed distribution demonstrates that, even under realistic environmental exposure scenarios in wetlands, where compounds may be both dissolved and bioaccumulated, the evaluated pharmaceuticals are unlikely to induce acute lethal effects in aquatic bird species. Collectively, these results reinforce the conclusion that the chemical space exhibits a robust avian safety profile across both terrestrial and aquatic ecological niches, supporting its environmental compatibility from a trophic risk perspective. |
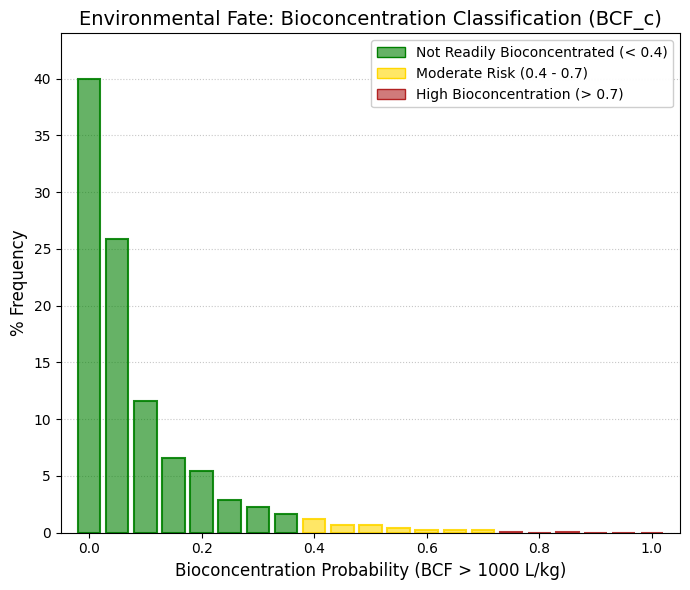
Bioconcentration: BCF (c).
Bioconcentration factor (BCF) quantifies the extent to which a substance accumulates in an aquatic organism relative to the surrounding water, defined as the ratio of its concentration in the organism to that in water at steady state. Practically, a high BCF indicates preferential uptake and retention in biota over persistence in the aqueous phase. Tools such as ADMETsar 3.0 operationalize its interpretation using a threshold of 1000 L/kg: compounds below this value are considered unlikely to bioconcentrate, whereas those above it exhibit significant bioaccumulation potential and warrant environmental and toxicological concern. The physicochemical basis of bioconcentration is closely linked to lipophilicity, typically expressed as logP (octanol/water partition coefficient). Because biological membranes and lipid stores are hydrophobic, compounds with higher logP more readily permeate membranes and partition into fatty tissues, leading to a general positive correlation between logP and BCF. However, this relationship is non-linear: BCF tends to increase with logP within a moderate range (≈ 2-6), but declines at very high logP due to reduced aqueous solubility (limiting bioavailability), increased molecular size (hindering membrane transport), and enhanced metabolic clearance. Additional determinants include ionization state (pKa), protein binding, and biodegradability. BCF was predicted using in silico models trained on standardized ecotoxicological datasets, primarily reflecting aqueous exposure studies in teleost fish (e.g., OECD 305 species such as Pimephales promelas and Oncorhynchus mykiss). Using the regulatory threshold of 1000 L/kg, classification modeling (BCF_c) indicated that, despite prior evidence of baseline narcosis toxicity in Tetrahymena pyriformis suggesting pronounced lipophilicity, this hydrophobicity does not translate into ecologically hazardous tissue retention. The mean population probability of bioconcentration was very low (0.083), with a strong skew toward environmental safety: 77.5% of scaffolds showed risk probabilities < 0.1, and 40% reached a probability of zero relative to the critical threshold. These findings suggest that, although the compounds possess sufficient lipophilicity for membrane permeation, their systemic accumulation is likely mitigated by efficient metabolism, compensatory polar surface area, or molecular size constraints that limit sustained partitioning into adipose reservoirs in higher trophic organisms. |
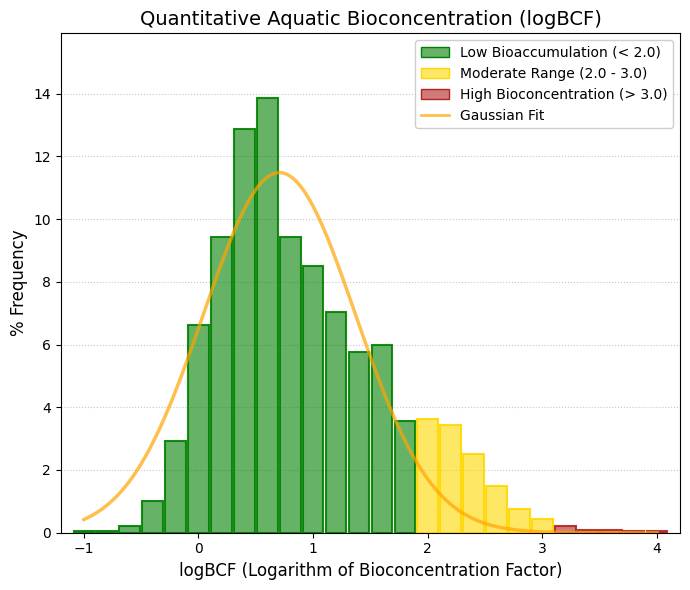
Bioconcentration: - logBCF.
To quantitatively resolve the magnitude of tissue-retention risk suggested by dichotomous classifications, the population distribution of the logarithmic bioconcentration factor (logBCF) was modeled against aquatic bioaccumulation benchmarks (primarily derived from OECD 305 assays in teleost fish). The analysis yielded a canonical normal distribution (Gaussian fit: amplitude = 11.48, SD = 0.66) centered well within the safety margin. The empirical population mean (logBCF = 0.88) and the theoretical peak of the curve (mean = 0.70) correspond to negligible concentration factors (~5-7 L/kg), several orders of magnitude below the critical regulatory threshold (logBCF > 3.0, equivalent to 1000 L/kg). The sharp attenuation in the right tail, with a near absence of scaffolds in the high-biocentration domain, confirms that the physicochemical profile of the library, likely governed by efficient metabolic clearance and/or steric constraints on partitioning, effectively suppresses biomagnification in aquatic systems, supporting the environmental compatibility of these candidates as therapeutic agents. |
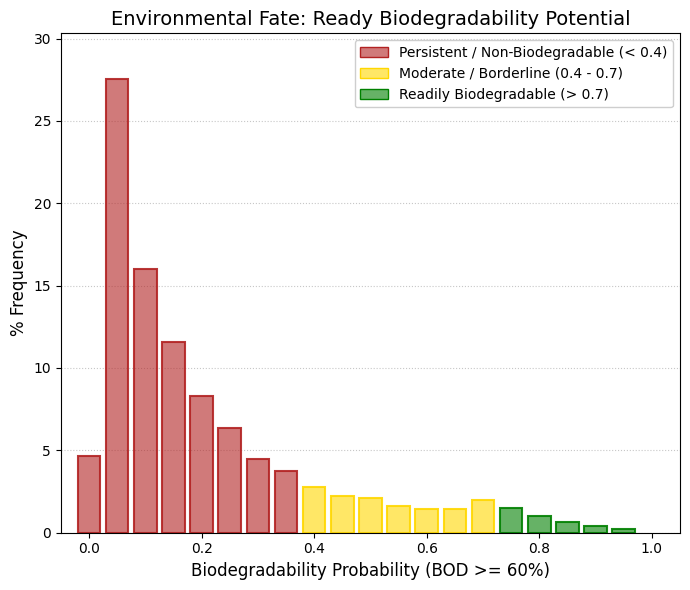
Biodegradability, as biological oxygen demand (BOD) >= 60%.
To evaluate the environmental fate of the approved drugs registered in DrugBank, the probability of ready biodegradability was assessed. Unlike toxicity models, this specific parameter evaluates the likelihood of a molecule being degraded by environmental microbial consortia, utilizing the regulatory threshold of Biological Oxygen Demand (BOD) ≥ 60% over a 28-day period (e.g., OECD 301 guidelines). Within this modeling framework, a low probability indicates environmental persistence, whereas a high probability denotes rapid and safe ecological clearance. The predictive analysis reveals extreme environmental persistence across the library, characterized by a low population mean of 0.21. Approximately 85% of the evaluated chemical scaffolds cluster within the low-probability deciles (< 0.4), heavily concentrated between 0.05 and 0.15. Conversely, a residual fraction of merely ~5% of the molecules surpasses the 0.7 probability threshold. This systemic environmental recalcitrance illustrates the well-known "pharmaceutical design paradox." To achieve a viable pharmacokinetic (ADME) profile in humans—which inherently requires surviving gastric acidity, intestinal enzymes, and hepatic first-pass metabolism—drugs are purposely engineered with highly stable structural features, such as reinforced amide bonds, aromatic rings, and halogen substitutions (e.g., fluorine). Consequently, the very physicochemical robustness required for clinical efficacy renders these molecules highly resistant to biotransformation by microorganisms in aquatic habitats, soils, and wastewater treatment plants. Despite this pronounced resistance to immediate biodegradation, the ultimate ecological risk is mitigated by the compounds' pharmacokinetic distribution profiles. As demonstrated in the previous Bioconcentration Factor (BCF) analysis, these molecules exhibit negligible tissue bioaccumulation. Therefore, while these pharmacological scaffolds are environmentally persistent, they do not trigger a risk of trophic biomagnification, safely avoiding the critical PBT (Persistent, Bioaccumulative, and Toxic) regulatory classification. |
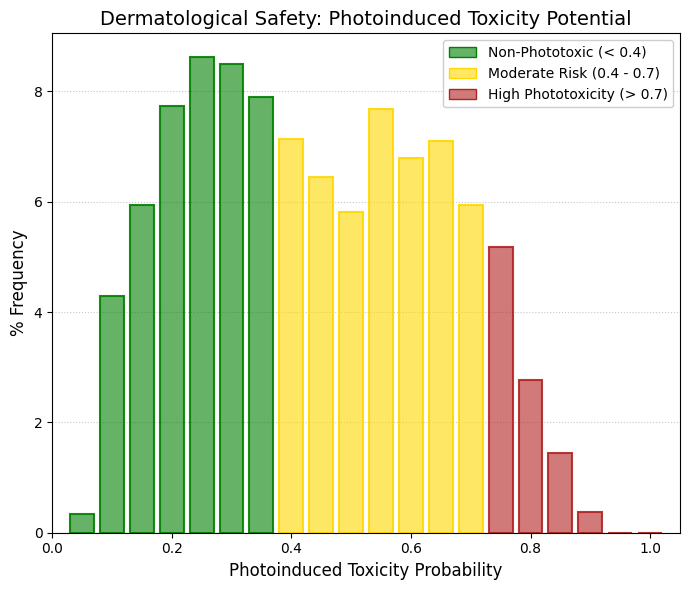
Photoinduced toxicity.
The risk of light-induced dermatological toxicity—encompassing both phototoxicity and photosensitization—was evaluated through the QSAR prediction of cutaneous photochemical reactivity. The approved therapeutic agents included in DrugBank exhibit a distinctly bimodal distribution (empirical population mean = 0.44), which is strongly indicative of two divergent chemical subpopulations within the database: 1) The Photostable Cluster (Low Risk): The primary cluster, peaking around a probability of 0.25, represents structural scaffolds that inherently lack highly reactive conjugated chromophores. This cohort falls safely within the low-phototoxicity zone (< 0.4). 2) The Photoreactive Cluster (Moderate-to-High Risk): Conversely, the secondary cluster demonstrates a significant accumulation within the moderate-to-high risk zone (probability ranges from 0.55 to 0.75). This specific probabilistic distribution is highly consistent with the presence of heavily conjugated substructures or halogenated ligands. Such architectural features are notoriously prone to UVA/UVB spectral absorption, inevitably leading to the localized generation of intradermal reactive oxygen species (ROS) upon light exposure. |
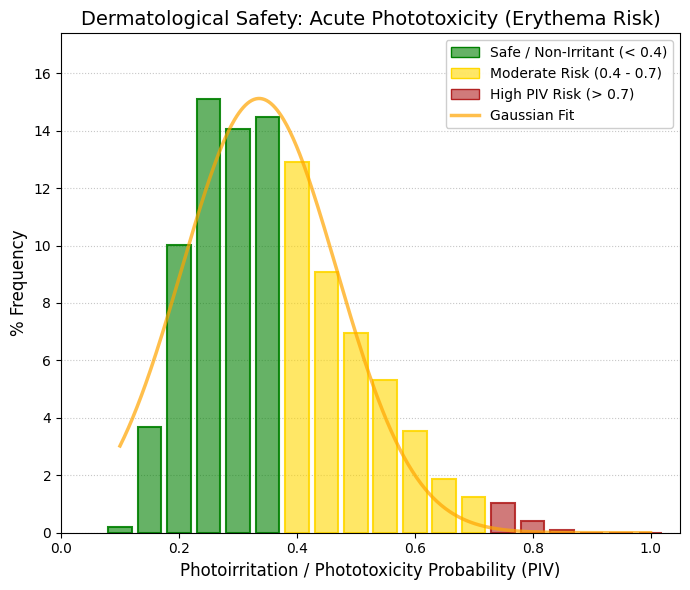
Phototoxicity/Photoirritation.
To further discern the underlying mechanisms of dermatological risk, the specific probability of photoirritation/phototoxicity (PIV) was evaluated. Unlike photoallergy, PIV is a strictly non-immunological, dose-dependent phenomenon characterized by the induction of acute erythema in skin areas exposed to light radiation. In stark contrast to the bimodal distribution observed in the broader photosensitization parameter, the algorithmic modeling for PIV converges into a high-fidelity unimodal Gaussian fit (R2 = 0.946$, Amplitude = 15.12). The population distribution exhibits a pronounced shift toward the safety spectrum, featuring a theoretical mean of 0.33 and an empirical peak centered tightly at 0.25. Approximately 60% of the evaluated structural analogues are comfortably situated well within the safety threshold (< 0.4). Mechanistically, this indicates a remarkably low propensity across the database to generate direct intracellular oxidative damage following photon excitation. Furthermore, there is a virtual absence of compounds within the high-reactivity deciles (> 0.7). This critical finding suggests that, although a distinct subpopulation of drugs may exhibit idiosyncratic, immune-mediated photoallergic susceptibility (as demonstrated in the broader photosafety screening), the baseline risk of acute, first-order phototoxic stress is marginal within the evaluated chemical library. |
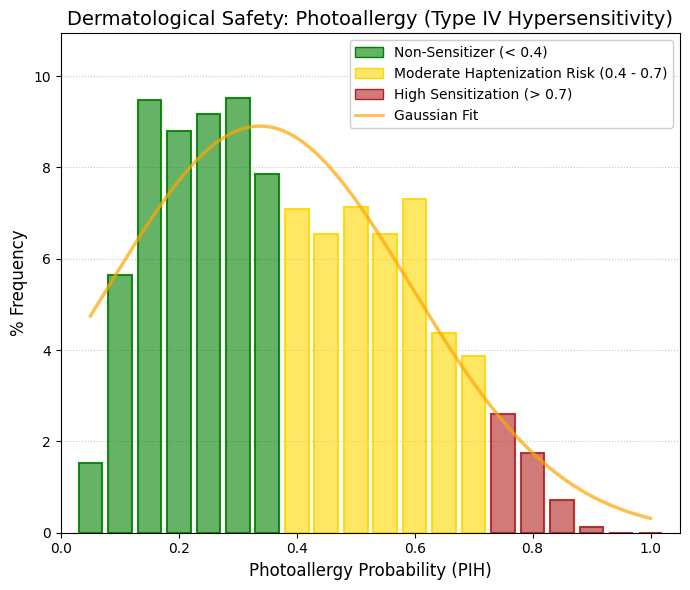
Photoallergy.
The mechanistic breakdown of global phototoxicity demonstrates that the primary risk associated with the approved therapeutics registered in DrugBank lies not in acute photoirritation (PIV), but rather in photoallergy (PIH). The specific evaluation of Type IV delayed hypersensitivity (PIH) accurately replicates the distributional thickening observed in the broader photosafety parameter. Characterized by an empirical mean of ~0.38 and an algorithmic fit of R2 = 0.85, the empirical data reveals a distinct frequency plateau between the 0.5 and 0.6 probability bins. This critical deviation from statistical normality suggests that a specific subfraction of the chemical library inherently possesses the potential to act as bioreactive chromophores upon light irradiation. Upon UV exposure, these specific structural architectures can undergo semi-antigenization (haptenization) by covalently binding to host dermo-epidermal proteins, thereby triggering a robust, cell-mediated immune cascade. Consequently, a clear toxicological divergence emerges: while the baseline risk of primary, dose-dependent erythematous damage (PIV) remains statistically insignificant across the database, immune-mediated photoallergy represents a tangible, albeit highly specific, clinical risk. Moving forward, the rational design of lead analogues derived from this photoallergic-prone subpopulation will strictly require the continuous in silico and in vitro monitoring of their photochromatic reactivity. This proactive approach is absolutely essential to prevent idiosyncratic cross-sensitization and ensure cutaneous biosafety in future clinical development phases. |
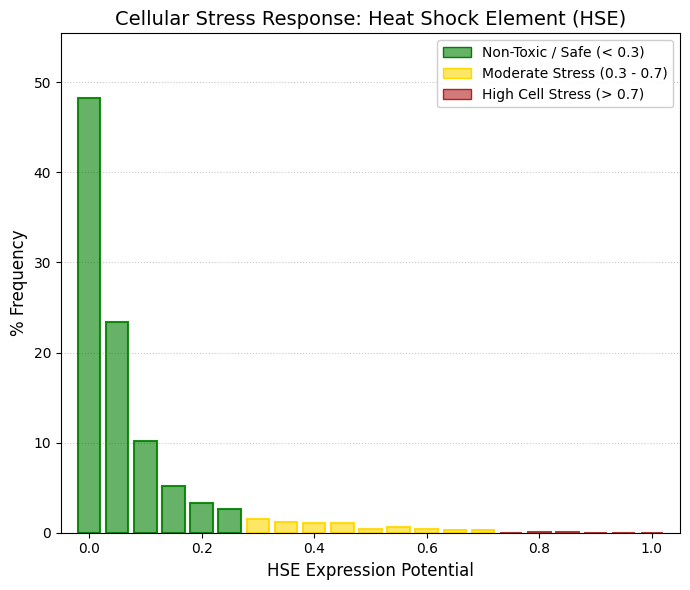
HSE: Heat shock factor response element.
Various chemicals, environmental and physiological stress conditions may lead to activation of the heat shock response/unfolded protein response (HSR/UPR). There are three heat shock transcription factors (HSFs) (HSF-1, -2, and -4) that mediate transcriptional regulation of the human HSR. Determine if the query molecule affects HSE expression. |
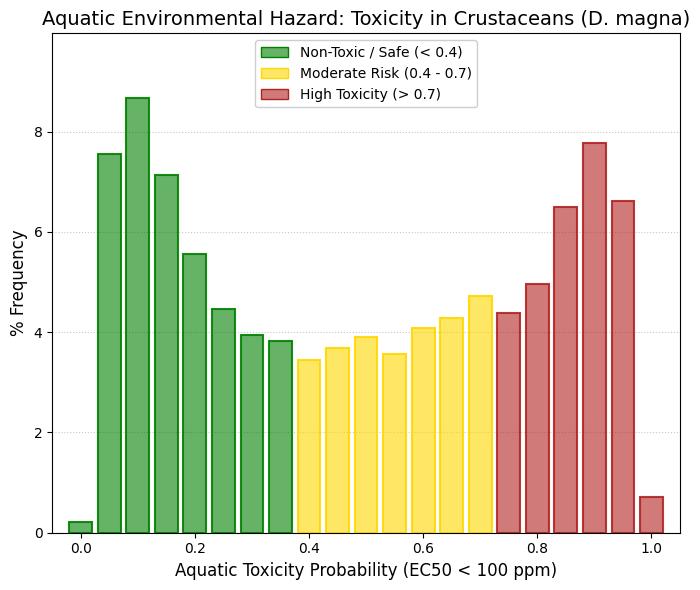
Aquatic toxicity (D. magna).
This dataset concerns the aquatic toxicity of compounds toward the freshwater crustacean Daphnia magna, a standard invertebrate model in regulatory ecotoxicology. In frameworks such as the European Chemicals Agency (REACH) and the United States Environmental Protection Agency, Daphnia magna is routinely used in standardized assays, such as OECD Test No. 202. Rather than measuring lethality, these assays typically evaluate motor inhibition as the endpoint, expressed as the half maximal effective concentration (EC50). Immobilization is considered a biologically relevant proxy for toxicity, as affected organisms lose the ability to swim, sink to the bottom, and are likely to die due to starvation or predation. In this context, a threshold of 100 ppm is commonly applied to classify compounds as toxic or non-toxic. Thus, the interpretation of results focuses on determining whether a given query molecule exhibits potential aquatic toxicity toward Daphnia magna based on its predicted or measured EC50 value. Analysis of DrugBank compounds reveals a markedly bimodal distribution of toxicity values. On one hand, there is a pronounced peak corresponding to compounds with low toxicity (approximately 0.05-0.15 probability range), indicating a large fraction of pharmacologically safe molecules. On the other hand, a substantial peak is observed at the high-toxicity end (approximately 0.85-0.95), reflecting a significant subset of compounds with strong immobilizing effects on Daphnia magna. This apparent paradox, namely, the high prevalence of toxicity among approved drugs, can be explained by the conservation of molecular targets across species. Many pharmaceuticals, including antidepressants, antiepileptics, and analgesics, act on ion channels and neurotransmitter systems (e.g., GABAergic and serotonergic pathways) that are evolutionarily conserved. Consequently, compounds designed to modulate the human nervous system can exert potent neurophysiological effects in aquatic invertebrates, leading to rapid immobilization in Daphnia magna. |
|
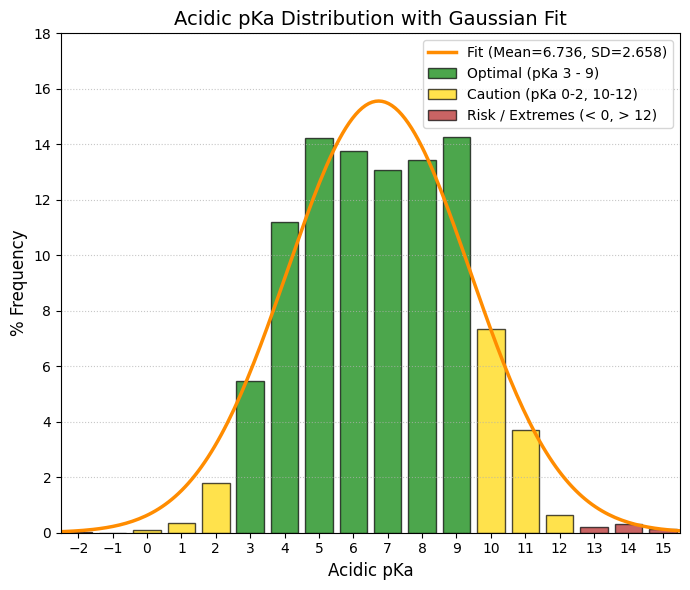
Acidic_pka.
The acidic pKa (Acidic_pKa) is an absolutely vital parameter for chemical navigability, as it determines the ionization state of the molecule at different physiological pH levels (stomach at pH ~1.5, intestine at pH ~6, and plasma at pH 7.4). A molecule that is too acidic will be completely ionized in the intestine, which greatly hinders its passive absorption across lipid membranes. Looking at your Gaussian distribution, we see a fantastic fit (R^2 = 0.9459) with a mean of 6.736, which makes perfect sense: most approved drugs with acidic groups are weak acids that maintain an equilibrium between their neutral and ionized forms. |
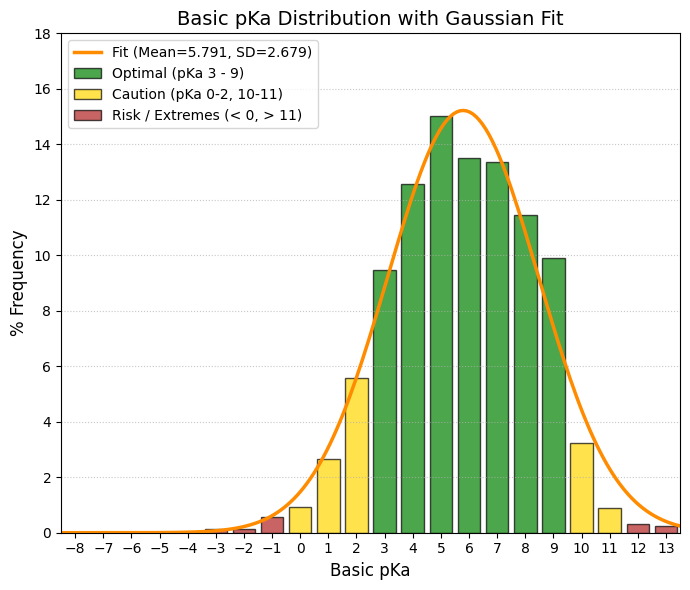
Basic_pka.
The basic pKa (Basic_pKa) is the other side of the ionization coin. With an average of 5.791, it indicates that the vast majority of drugs with basic groups in DrugBank are weak bases (like many amines). This allows them to be partially non-ionized at intestinal pH (~6.0) to cross membranes and be absorbed, but sufficiently ionized in the stomach to dissolve well. |